Many statistics, prices and legal examples here come from Germany; the operating faults and fixes apply to commercial buildings anywhere. Legal references are general information, not legal advice (status: October 2026).
Key points
- If you want to reduce energy costs in commercial buildings, the first levers are usually in daily operation, not new equipment: plant running outside occupied hours, heating curves and setpoints set too high, heating and cooling fighting each other, ventilation always at full speed.
- Buildings use around 40% of the energy consumed in the EU [21]. In Germany’s commercial and services sector, space heating is the largest single use, at just under half of final energy use in 2024 [4].
- A Lawrence Berkeley National Laboratory analysis of 643 existing US buildings found a median saving of 16% of total energy use from commissioning and re-tuning, with a payback of about one year [1]. Other evaluations show much smaller and very variable effects [14].
- The waste usually stays invisible because operators see annual bills, not room data or time profiles. A worked example and a priority table show where to start.
Where the money goes: energy use in commercial buildings
Non-residential buildings are a minority of the stock but a large block of energy demand. The European Commission states that around 40% of the energy consumed in the EU is used in buildings, and that 75% of EU buildings have poor energy performance [21]. In the United States, the ENERGY STAR programme of the Environmental Protection Agency says that commercial buildings and industrial plants account for half of national energy use, and that often up to 30% or more of that energy is wasted through inefficiencies [20].
Germany offers detailed figures. According to the German Energy Agency (dena), about 2 million of roughly 21 million recorded non-residential buildings fall under building energy law and are relevant for energy use. In 2022, non-residential buildings accounted for 325 of 1,003 TWh of final energy used by buildings, or 32% (excluding industry) [2]. For heat alone in non-residential buildings, the dena building report gives final energy use of 214.1 TWh for 2024 [5].
The energy balances of the German Working Group on Energy Balances (AGEB) show what the commercial and services sector uses its energy for. In 2024, 49.9% of final energy went into space heating, 13.5% into mechanical energy (for example motors for pumps, fans and lifts), 13.3% into information and communication technology, 12.5% into lighting, 3.5% into hot water and 2.5% into space cooling [4].
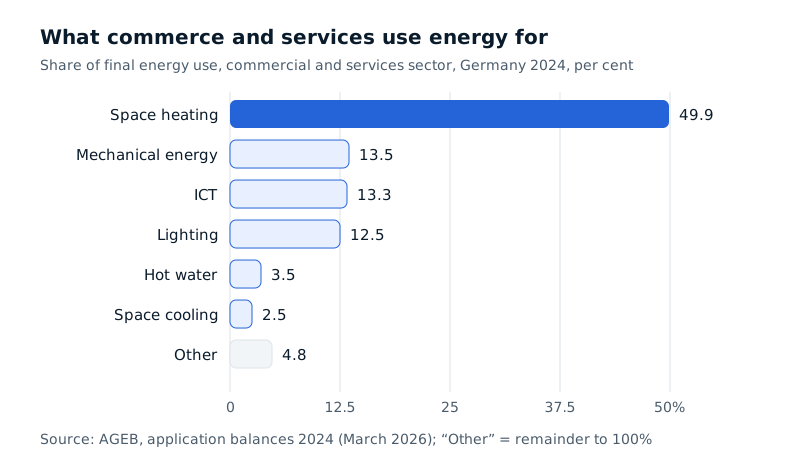
Figure 1: Final energy use in Germany’s commercial and services sector in 2024, by application. Sources: [4].
Offices look similar. A baseline study for dena estimates the German stock at about 310,800 office and administrative buildings; most of their energy, 69%, goes into space heating, followed by lighting at 13% [3]. Retail is different: in 2022 it used 26.6 TWh, of which about 19.3 TWh was electricity and only about 7.3 TWh heat [2]. Cooling, lighting and long opening hours drive the bill there.
Costs depend on local tariffs. In Germany, non-household customers paid an average of 6.29 euro cents per kWh for natural gas in the first half of 2026, and 8.11 cents in the band of 1,000 to 10,000 gigajoules a year (about 280 to 2,800 MWh). Electricity averaged a provisional 17.64 cents per kWh, and 23.66 cents in the band of 20 to 500 MWh a year; averages exclude VAT and other recoverable taxes [6]. Mid-sized offices, hotels and shops typically fall into these smaller consumption bands and pay more per kWh than large consumers.
Six places commercial buildings waste energy in operation
The typical faults are remarkably consistent. Among deficiencies fixed during commissioning, the Lawrence Berkeley National Laboratory (LBNL) analysis lists simultaneous heating and cooling, miscalibrated or faulty controls and sensors, disabled efficiency features such as variable-speed drives locked at full speed, leaky air distribution, unsuitable setpoints and control sequences, and oversized equipment [1]. A research paper by Fraunhofer IOSB on the German building stock describes a large share of heating systems as set up in an energetically suboptimal way, with heating and ventilation mostly run without coordination and not according to demand [16]. The main losses fall into six groups.
1. Out-of-hours heating and ventilation
An office may be occupied eleven hours on a working day and not at all at weekends and on holidays. At 250 working days of eleven hours each, that is 2,750 hours, or about 31% of the 8,760 hours in a year (our assumption). If heating and ventilation run without a matching time schedule, an empty building is kept at comfort level for almost 70% of the hours. This out-of-hours HVAC energy waste has familiar causes: a schedule that was never re-enabled after a fault, a wrong public holiday calendar, occupancy that changed after a refit, or one tenant with longer hours setting the schedule for the whole building.
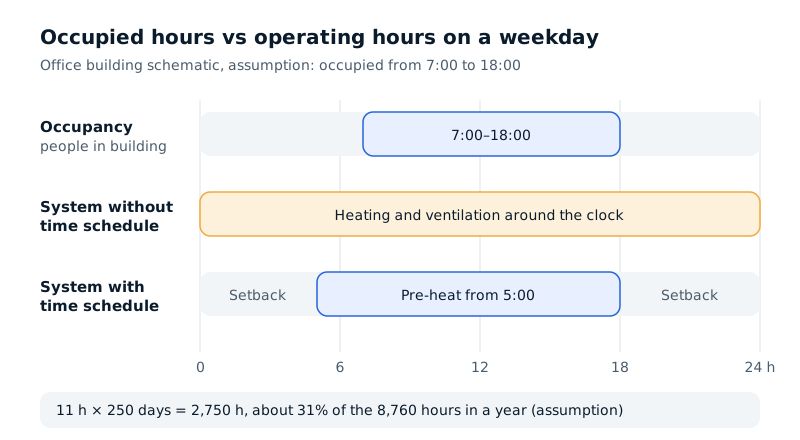
Figure 2: Occupied hours and operating hours on a weekday (schematic with assumed times).
A demonstration building in Stuttgart shows how large the effect of a longer setback can be: after the night setback was extended from 3.5 to 7.5 hours, the heat delivered in December 2013 fell by about 3,500 kWh compared with the same month a year earlier. The building is mixed-use (residential and commercial), however, and this is a single case [16].
2. Heating curve and setpoints set too high
The heating curve defines how warm the heating water should be at a given outdoor temperature. If it is too steep or too high, rooms get warmer than necessary. Occupants then open windows or turn down thermostatic valves, and the surplus heat is lost. Because nobody complains about a curve that is too high, it often stays unchanged for years. Room setpoints are similar. For light, seated work, the German workplace rule ASR A3.5 sets a minimum temperature of +20 °C [12][13]; many offices are run noticeably warmer. A rule of thumb used by German consumer advice centres and state authorities is that each degree less room temperature saves about 6% of heating energy [10][11]. The rule comes from housing; in buildings with high internal heat gains from people and equipment, the effect can be smaller.
3. No hydronic balancing
Without hydronic balancing, heating water flows mainly through the radiators with the least resistance, usually those close to the pump. Distant rooms stay cool. The usual but expensive response is to turn up the pump and the flow temperature until the last room is warm. Then every other room is too warm. The Fraunhofer paper notes that balancing is often difficult in existing buildings because the pipe layout is not documented [16].
4. Simultaneous heating and cooling
In air-conditioned buildings, a room is sometimes heated and cooled at the same time: the radiator is on while the air-conditioning unit or ventilation system cools, or supply air is cooled centrally and reheated in the rooms. LBNL explicitly lists simultaneous heating and cooling among the faults found [1]. Typical causes are overlapping setpoints without a sufficient dead band, separate controls from different trades, and occupants intervening themselves.
5. Ventilation running at full speed
Many ventilation systems run at a fixed speed regardless of occupancy. That costs twice: fan electricity, and heat to warm outdoor air in winter. Under the affinity laws, the power drawn by fans and pumps varies roughly with the cube of speed; half speed means, in theory, one eighth of the power. This model only holds well in a middle range of speeds [17], but it shows why demand-controlled ventilation can achieve so much. Airflow must not fall below what the use and air quality require; a CO₂ reading in the room helps to judge this.
6. Electricity peaks and demand charges
Where a tariff includes a capacity or demand charge, a short peak can be expensive. In Germany, for connections with power metering, network charges under § 17 of the Electricity Network Charges Ordinance (Stromnetzentgeltverordnung, StromNEV) consist of an energy price and an annual capacity price that is multiplied by the highest load in the billing year [9]. One morning quarter-hour when ventilation, pumps, kitchen, refrigeration and lifts start together can shape the cost for the whole year. For low-voltage connections taking up to 100,000 kWh a year without power metering, an energy price per kWh applies instead [9].
Why the waste stays hidden
These faults go unnoticed for three reasons.
There is no room data. Nobody sees whether a room is held at 22 °C overnight or whether the ventilation runs at the weekend unless they happen to be there. Without temperature, CO₂ and occupancy data from the rooms, nobody can check whether the plant matches the use.
The annual bill only shows a total. A gas bill for 300,000 kWh does not say how much of it went on nights, weekends or badly set zones. A rise could be weather, occupancy or a fault. Only hourly or 15-minute meter readings show when energy flows.
Responsibilities are split. Owner, tenants, facility management, heating contractor and controls provider each see only part of the picture. When a tenant complains about the cold, the flow temperature goes up; nobody is responsible for lowering it again. The Fraunhofer authors also name poor cost feedback to users as a problem [16].
The result is higher energy costs with no extra benefit, plus side effects: overheated rooms get cooled through the window, which in winter can mean dry air and draughts, and uneven temperatures lead to complaints and further interventions that throw the system further out of adjustment.
Retro-commissioning and building re-tuning: what the studies show
Retro-commissioning means checking and readjusting existing systems without replacing them: schedules, heating curves, setpoints, control sequences and airflows. Building re-tuning is a closely related term for the same kind of low-cost operational adjustment.
LBNL 2011 (USA, 643 buildings). For Lawrence Berkeley National Laboratory, Evan Mills analysed a database of 643 buildings in 26 US states. In existing buildings, fixing the deficiencies found gave a median total energy saving of 16%. Median cost was US$0.30 per square foot (about US$3 per square metre, 2009 prices), and the payback period was 1.1 years [1]. Limits: this is a collection of completed projects, not a representative sample, and the buildings are in the US, with other climates, systems and energy prices.
Swiss Federal Office of Energy 2019 (Switzerland, about 500 properties). A study by Amstein+Walthert and Lucerne University of Applied Sciences, reported by the Swiss Federal Office of Energy (SFOE), looked at about 500 properties with 1,300 buildings optimised between 2012 and 2016. Heat use for space heating and hot water fell by 5% on average; in many buildings about 10% was possible, 15% or more was very rare. About 30% of the buildings showed no measurable saving [14]. Limit: most were mid-sized residential buildings, not offices.
PNNL (USA, simulation). The Pacific Northwest National Laboratory simulated re-tuning measures for a prototype large office building in 16 climate zones. Many measures on air systems and schedules cut simulated annual heating, ventilation and air-conditioning energy use by more than 20% in most cities; measures on the plant side mostly brought less than 5% [15]. Limit: these are model calculations, not measurements.
Retro-commissioning is usually cheap and often pays off, but the range is wide. Whether a building saves 0%, 5% or 16% depends on how badly it was set up before. That cannot be judged without measurement.
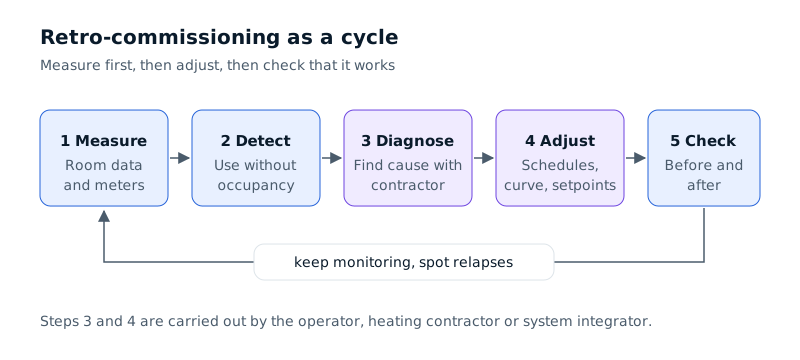
Figure 3: Retro-commissioning as a cycle of measuring, adjusting and checking.
Continuous monitoring is also gaining legal weight. The EU Energy Performance of Buildings Directive requires non-residential buildings with heating, air-conditioning or combined ventilation systems above 70 kW to have building automation and control systems by 31 December 2029, where technically and economically feasible; these must continuously monitor, log and analyse energy use and detect efficiency losses [22]. Germany implements this in § 56 of the Building Modernisation Act (Gebäudemodernisierungsgesetz, GModG), which also requires monitoring of indoor climate quality [8]. General information, not legal advice (status: October 2026). Whether the duty applies to your building is a question for a building services engineer or legal adviser.
How to reduce energy costs in commercial buildings: no-cost and low-cost measures
Match schedules to actual use
First compare when the building is actually occupied with when heating, ventilation, cooling and lighting run. Room data (temperature, and CO₂ as a sign of occupancy) next to hourly meter readings shows deviations quickly. Rising heat use at night without any rise in CO₂ points to operation without occupancy. Pre-heat times matter, since well-insulated buildings cool little overnight and heavy construction reacts slowly; rooms must reach the required temperature when work starts.
Optimise the heating curve and check setpoints
To optimise the heating curve, lower it step by step, watch room temperatures over several days with different outdoor temperatures, and correct where individual rooms get too cool: with room data, on measurements rather than complaints. For setpoints, check the lower limit set by workplace rules (in Germany ASR A3.5 [12][13]) and zones with special needs, such as server rooms that must be cooled rather than heated.
Get hydronic balancing done properly
Hydronic balancing is a job for a heating contractor. In Germany, § 60c GModG requires it after a water-based heating system is installed in buildings with at least six dwellings or other independent units of use, including a room-by-room heat load calculation, a check of the heat emitters and adjustment of the flow temperature control [7]. Room measurements show beforehand which areas are permanently too warm or too cool, and check the result afterwards.
Separate heating and cooling
Set heating and cooling setpoints with enough gap between them and coordinate the controls of the different trades. Rooms where heating and cooling draw energy at the same time only show up when data from both systems is analysed together.
Run ventilation on demand
Ventilation controlled by a time schedule and, where the system allows, by air quality runs fewer hours and less often at full speed. CO₂ readings in the rooms show whether the reduced airflow is enough. HVAC optimisation with occupancy sensors follows the same logic for heating and cooling. Changes to the controls are a job for the installer or system integrator; minimum airflows from the design and occupational health and safety rules still apply.
Reduce peak demand charges
To reduce peak demand charges, you first have to see the peaks: the load profile in 15-minute values shows when the annual maximum occurs. For connections with power metering, the metering operator or supplier can usually provide it. Often it is enough to stagger the start of large loads, such as ventilation units, chillers, kitchen equipment or charging points. A dashboard that shows the load profile and limits helps with ongoing monitoring.
Hotels and retail: different profiles, same logic
Hotels run around the clock with strongly changing occupancy: unoccupied rooms, empty meeting rooms and spa areas outside opening hours are the equivalent of the office at night (see hospitality). In retail, electricity is the bigger item [2]; lighting, refrigerated display cases and air-conditioning drive the bill. Here the hours before and after opening deserve the closest look (see retail buildings).
Prioritisation: where to start
| Measure | Effort | Typical lever | Data needed |
|---|---|---|---|
| Match schedules to use | low, usually a setting | heat and electricity outside occupied hours | occupancy times, room temperature, CO₂, hourly meter data |
| Check room setpoints | low | heat; rule of thumb about 6% per degree (housing) [10][11] | room temperatures per zone over several weeks |
| Optimise heating curve | low to medium, step by step | flow temperature, heat losses, generator efficiency | outdoor temperature, flow temperature, room temperatures |
| Fix simultaneous heating and cooling | medium, trades must coordinate | heat and cooling at the same time | setpoints and operating states of both systems, room temperature |
| Demand-controlled ventilation | medium, controls may need changes | fan electricity and heat for outdoor air | CO₂, operating hours and fan stages |
| Smooth load peaks | low to medium | capacity charge in network fees [9] | load profile in 15-minute values |
| Hydronic balancing | medium to high, specialist contractor | even heat distribution, lower flow temperature | heat load, heat emitters, room temperatures before and after |
Table 1: Retro-commissioning measures by effort, lever and data needed. Effort and lever are qualitative estimates and depend on the building.
Worked example (illustrative): reducing energy costs in an office building
This is our own model calculation with German prices. It shows orders of magnitude and does not replace an analysis of a real building. For more on how to reduce energy consumption in office buildings, see the page on this building type.
Assumptions:
- Office building with 3,000 m² net floor area, gas boiler, no cooling.
- Heat use 300,000 kWh a year (assumed 100 kWh/m²); that is about 1,080 GJ, in the German statistics band of 1,000 to 10,000 GJ.
- Electricity use 120,000 kWh a year (assumed 40 kWh/m²), in the 20 to 500 MWh band.
- Prices: natural gas 8.11 cents/kWh, electricity 23.66 cents/kWh (German Federal Statistical Office, first half of 2026, non-household customers, respective consumption band) [6].
- Occupied on 250 days from 7:00 to 18:00.
Starting point: heat 300,000 kWh × €0.0811/kWh = €24,330 a year. Electricity 120,000 kWh × €0.2366/kWh = €28,392 a year. Together about €52,700 a year.
| Scenario | Calculation | Saving per year |
|---|---|---|
| Room setpoint 22 → 21 °C | 6% × 300,000 kWh = 18,000 kWh × €0.0811 | about €1,460 |
| Retro-commissioning, 5% of energy costs (based on the SFOE average for heat in residential buildings [14]) | 5% × €52,722 | about €2,640 |
| Retro-commissioning, 10% | 10% × €52,722 | about €5,270 |
| Retro-commissioning, 16% (LBNL median, existing US buildings [1]) | 16% × €52,722 | about €8,440 |
| Cut the load peak by 10 kW | 10 kW × assumed capacity price of €100 per kW and year | about €1,000 |
Table 2: Worked example for a 3,000 m² office building. All values are assumptions or calculated from the sources named.
How to read it: the scenarios overlap and cannot be added up; lowering the setpoint is part of retro-commissioning. The capacity price of €100 per kW and year is purely a calculation value; actual prices are on the network operator’s price sheet and vary widely, and network charges are already included in the average statistical prices. Even a moderate saving in a building of this size is worth several thousand euros a year. Whether the real figure is closer to 0% or 16% can only be judged with measured data.
Common mistakes when looking for savings
- Investing before adjusting. A new heat pump or ventilation unit works only as efficiently as its schedules, curves and setpoints allow.
- Blanket setbacks without checking. Cut heating by two degrees everywhere without measuring, and some areas get cold, fan heaters appear and electricity use rises.
- Optimise once, then forget. The effect of operational optimisation does not last by itself. A report by the Center for Energy and Environment for the City of Saint Paul therefore recommends repeating re-tuning about every five years [19]; a paper from the Swiss Federal Office of Energy suggests a similar interval [14].
- Working without a baseline. Without measuring first, you cannot prove a measure worked or separate weather effects from savings.
How Nebatic helps
Nebatic addresses the main reason losses stay hidden: missing room and meter data. The Nebatic Core and Nebatic AirSense devices record temperature, humidity and CO₂ in rooms, among other parameters, and connect via Wi-Fi. Existing sensors, meters and building systems can be connected to the platform. It shows live values, trends, anomalies and alerts, so you can see, for example, whether rooms are kept warm outside occupied hours.
To find out where a building stands, owners can commission a measurement for an agreed period through Audit & Analysis and receive an evaluation with recommendations, for example a before-and-after measurement around a settings change. The settings of heating, ventilation and building automation are still changed by operators, heating contractors or system integrators; Nebatic provides the data so that these decisions rest on measurements.
Limits and risks
- Retro-commissioning does not replace renovation. A poorly insulated building with an old heating system stays expensive to run even when well set up; larger investments need an energy audit or energy consultant. In Germany, BAFA (Federal Office for Economic Affairs and Export Control) funds energy advice for non-residential buildings, with modules such as an energy audit to DIN EN 16247 and energy advice to DIN V 18599 [18]. Check funding with BAFA, KfW or an energy consultant, or elsewhere with the national energy agency.
- Savings are not guaranteed. In the Swiss evaluation, about a third of buildings showed no measurable saving after optimisation [14]. Study results from the US cannot be transferred directly to European buildings [1][15].
- Comfort and occupational safety come first. Setbacks and lower airflows must respect workplace rules and the system design [12]. For health complaints, the occupational health service is the right contact.
- Changes to plant belong in expert hands. Hydronic balancing, control changes and work on domestic hot water systems are jobs for specialist contractors and design engineers; manufacturer specifications and maintenance contracts still apply.
- Monitoring is not automatically building automation in the legal sense. Whether a solution meets the requirements of § 56 GModG or the national equivalent is assessed by design engineers and, where needed, legal advisers [8].
- Leases. Settings that affect let areas must respect lease terms on temperatures and operating hours.
Frequently asked questions
How can a business reduce energy costs without major investment?
Start with settings, not investment: schedules, setpoints, heating curve, simultaneous heating and cooling, demand-controlled ventilation and load peaks. LBNL found a median payback of about one year for this kind of work [1]. The precondition is seeing when and where energy is used.
How do you reduce heating costs in an office building?
In offices, most energy goes into space heating; the dena study puts it at 69% [3]. The most effective first steps are usually a setback outside office hours, appropriate room setpoints (in Germany at least 20 °C for light, seated work under ASR A3.5 [13]) and a correctly set heating curve.
What is retro-commissioning?
Retro-commissioning is the systematic check and readjustment of existing building systems, such as schedules, heating curves, setpoints, control sequences and airflows, without replacing them. In the LBNL analysis of existing buildings, it achieved a median saving of 16% with a payback of 1.1 years [1]; a Swiss evaluation found an average of 5% for heat, with no measurable saving in about 30% of buildings [14].
Is hydronic balancing mandatory for commercial buildings?
In Germany, § 60c GModG requires hydronic balancing after a water-based heating system is installed in buildings with at least six dwellings or other independent units of use [7]. Whether this applies to your building depends on the system and the use; other countries have their own rules. General information, not legal advice (status: October 2026).
How can hotels reduce energy costs?
Hotels run around the clock, but not every area is in use. Start with setbacks in unoccupied rooms and meeting rooms, schedules for kitchen, spa and ventilation, and avoiding peaks when kitchen and building services start together.
How do you reduce peak demand charges?
First analyse the load profile in 15-minute values and find when the peaks occur. Then stagger the start of large loads. For connections with power metering in Germany, the annual peak load sets the capacity price in the network charges [9].
How do you analyse the energy consumption of a building?
Combine high-resolution meter data with room data such as temperature and CO₂; only the comparison shows whether energy is used when nobody is there. For a deeper investigation, a time-limited measurement with evaluation or an energy audit by an energy consultant is the next step [18].
Sources
- Mills, E. / Lawrence Berkeley National Laboratory (2011): Commissioning: A Highly Cost-Effective Building Energy Management Strategy. https://escholarship.org/content/qt1wj273zg/qt1wj273zg.pdf
- German Energy Agency (dena) (2023): Fokusthemen Einzelhandel in Deutschland. Handelsgebäude – Analyse der Nichtwohngebäudetypen, Teil 1 [Retail in Germany: retail buildings – analysis of non-residential building types, part 1]. https://www.gebaeudeforum.de/fileadmin/gebaeudeforum/Downloads/Gebaeudereport/Gebaeudeforum_GR24_Fokusthemen_Einzelhandel.pdf
- German Energy Agency (dena) / German Economic Institute (IW Köln) (2016): Energieeffizienz bei Büroimmobilien. dena-Analyse [Energy efficiency in office properties]. https://www.tab.de/download/1050143/dena-Analyse-Energieeffizienz-Bueroimmobilien.pdf
- Working Group on Energy Balances (AGEB) (2026): Anwendungsbilanzen zur Energiebilanz Deutschland, Datenjahr 2024 [Energy use by application, Germany, data year 2024]. https://ag-energiebilanzen.de/wp-content/uploads/EBD24e_AnwBil.pdf
- German Energy Agency (dena) (2026): dena-Gebäudereport 2026. Zahlen, Daten, Fakten zum Klimaschutz im Gebäudebestand, update report April 2026 [dena building report 2026]. https://www.dena.de/fileadmin/dena/Publikationen/PDFs/2026/GR_Update_April26.pdf
- Federal Statistical Office of Germany (Destatis) (2026): Strom- und Gaspreise für Haushalte im 1. Halbjahr 2026 gesunken [Electricity and gas prices for households fell in the first half of 2026], press release no. 345. https://www.destatis.de/DE/Presse/Pressemitteilungen/2026/09/PD26_345_61243.html
- Gebäudemodernisierungsgesetz (GModG), § 60c Hydraulischer Abgleich und weitere Maßnahmen zur Heizungsoptimierung [Hydronic balancing and other heating optimisation measures]. https://www.gesetze-im-internet.de/geg/__60c.html
- Gebäudemodernisierungsgesetz (GModG), § 56 Gebäudeautomatisierung und Gebäudesteuerung [Building automation and control]. https://www.gesetze-im-internet.de/geg/__56.html
- Stromnetzentgeltverordnung (StromNEV), § 17 Ermittlung der Netzentgelte [Calculation of network charges]. https://www.gesetze-im-internet.de/stromnev/__17.html
- Verbraucherzentrale Hamburg (2025): Gas und Fernwärme: So senken Sie Ihre Heizkosten [Gas and district heating: how to cut your heating costs]. https://www.vzhh.de/themen/bauen-immobilien-energie/heizung/gas-fernwaerme-so-senken-sie-ihre-heizkosten
- State portal of Baden-Württemberg (2022): CLEVERLÄND-Tipp Nr. 8: Auf die Einstellung kommt es an [Tip no. 8: the setting is what counts]. https://www.baden-wuerttemberg.de/de/service/media/mid/cleverlaend-tipp-nr-8-auf-die-einstellung-kommt-es-an
- Federal Institute for Occupational Safety and Health (BAuA): Technical Rule for Workplaces ASR A3.5 Room temperature (2010 edition, last amended 2022). https://www.baua.de/DE/Angebote/Regelwerk/ASR/ASR-A3-5
- Haufe Arbeitsschutz: ASR A3.5: Ab wann ist die Raumtemperatur am Arbeitsplatz zu kalt? [When is a workplace too cold?]. https://www.haufe.de/arbeitsschutz/gesundheit-umwelt/asr-a35-ab-wann-ist-die-raumtemperatur-zu-kalt_94_530038.html
- Vogel, B. / Swiss Federal Office of Energy SFOE (2019): Betrieb optimiert, Wärmeverbrauch gesenkt [Operation optimised, heat use reduced]. https://pubdb.bfe.admin.ch/de/publication/download/9747
- Pacific Northwest National Laboratory: Energy Savings Modeling of Standard Commercial Building Re-tuning Measures: Large Office Buildings. Report PNNL-21569. https://www.osti.gov/biblio/1048616
- Bernard, T.; Jacubasch, A.; Plagge, K.; Wolfrum, K.; Menzel, M.; Garrecht, H.; Blatt, C. (2014): Monitoring und Automatisierung im Gebäudebestand [Monitoring and automation in the existing building stock]. EnOB Symposium 2014, Fraunhofer IOSB. https://www.iosb.fraunhofer.de/content/dam/iosb/iosbtest/documents/projekte/e-monaut/Paper%20Monitoring%20im%20Gebaeudebestand_EnOB%20Symposium%202014.pdf
- Held, E. (2015): Wie funktioniert eigentlich … das Proportionalgesetz? Linear, quadratisch, kubisch [How do the affinity laws work? Linear, square, cubic]. SBZ Monteur 05/2015. https://www.sbz-monteur.de/sites/default/files/sbzm_pdf/file_650348.pdf
- Federal Office for Economic Affairs and Export Control (BAFA): Bundesförderung für Energieberatung für Nichtwohngebäude, Anlagen und Systeme [Federal funding for energy advice for non-residential buildings, plants and systems]. https://www.bafa.de/DE/Energie/Energieberatung/Nichtwohngebaeude_Anlagen_Systeme/nichtwohngebaeude_anlagen_systeme_node.html
- Shen, L.; Nelson, C.; Jones, K.; Steigauf, B.; Kessler, N. / Center for Energy and Environment (2018): Accelerating Energy Performance in Large Buildings. Report for the City of Saint Paul. https://www.mncee.org/sites/default/files/report-files/Lrg-Bldg-Operational-Savings-Report_CEE_2018-10-31-%281%29%20%281%29.pdf
- ENERGY STAR / US Environmental Protection Agency: About ENERGY STAR for commercial and industrial buildings. https://www.energystar.gov/buildings/about-us
- European Commission, Directorate-General for Energy: Energy Performance of Buildings Directive. https://energy.ec.europa.eu/topics/energy-efficiency/energy-performance-buildings/energy-performance-buildings-directive_en
- European Parliament and Council (2024): Directive (EU) 2024/1275 of 24 April 2024 on the energy performance of buildings (recast), Article 13(9) and (10). https://eur-lex.europa.eu/eli/dir/2024/1275/oj/eng