The data method in this article applies to any EU portfolio. For legal duties it uses the EU frameworks and, as the worked case, the German rules (Building Modernisation Act (Gebäudemodernisierungsgesetz, GModG), Metering Point Operation Act (Messstellenbetriebsgesetz, MsbG)); other EU countries implement the EU directives in their own laws. General information, not legal advice (status: October 2026).
Key points
- What it is: Multi-site energy monitoring means collecting the consumption data of every building in a portfolio in one place, checking it, normalising it for floor area and weather, and comparing it with benchmarks. Only these four steps turn scattered meter readings into a reliable overview.
- The problem: Energy data sits in invoices, supplier portals, smart meter feeds, building management systems and spreadsheets. Annual bills arrive late, and errors often surface months later.
- The data often exists already: In Germany, sites using more than 100,000 kWh of electricity a year are metered by law with interval data, down to 15-minute load profiles [1]. Many owners do not use these data systematically.
- Comparison needs a method: Recognised tools include German Weather Service climate factors [7], the VDI 3807 method [8] and official benchmarks for non-residential buildings [6].
- ESG: CSRD, the EU Taxonomy, CRREM and GRESB all need consistent energy data per building [12][13][17][21]; the legal framework changed substantially in 2026.
This article is for asset, property and facility managers and ESG advisers who look after buildings in several locations or countries. It explains why portfolio energy data is fragmented, what a usable portfolio view needs, how investor and EU frameworks use the data, and how to judge multi-site energy monitoring tools neutrally.
Multi-site energy monitoring: why portfolio data is scattered and late
Anyone responsible for ten, fifty or several hundred buildings knows the picture. The electricity invoice for site A is a PDF in the accounts inbox. The gas bill for site B sits in another supplier’s portal. The 15-minute load profile of a large office is in the grid operator’s portal, sub-meter heat readings are in the building management system (BMS), and the caretakers’ readings are in a spreadsheet. Each source is correct on its own. Together, they give no picture anyone can compare.
The scale shows why ordering the data is worth the effort. According to the dena Building Report 2026, final energy use for heating in non-residential buildings in Germany was 214.1 TWh in 2024, around 63% of it from fossil fuels (oil, gas, coal) [11]. Electricity for lighting, ventilation, cooling and equipment comes on top.
Four causes of fragmented energy data
1. Many sources, many formats. Invoices give one figure per billing period, portals export CSV files, building management systems use their own data point names, and spreadsheets hold whatever somebody typed in. Units (kWh, m³ of gas, MWh), periods and meter names rarely match.
2. Different time resolution. In Germany, the Metering Point Operation Act requires a metered-reading series or, where necessary, a 15-minute registered load profile for end users consuming more than 100,000 kWh of electricity a year [1]. Above 6,000 kWh, metering operators must install smart metering systems (smart meter gateways) by statutory deadlines [2]. Many smaller sites, and most gas and district heating supplies, still have only monthly or annual values.
3. Delay. An annual bill describes the past. A faulty valve, a ventilation unit running around the clock or heating left on at weekends costs money for months before the invoice shows it. German law recognises this for heating in rented space: where remotely readable devices are installed, occupants have been entitled since 1 January 2022 to monthly consumption information, compared with the previous month and the same month a year earlier [3].
4. Missing allocation. A meter is not automatically linked to a building, a floor area or a use. Without clean master data (meter number, building, energy type, area served, type of use), no metric can be calculated.
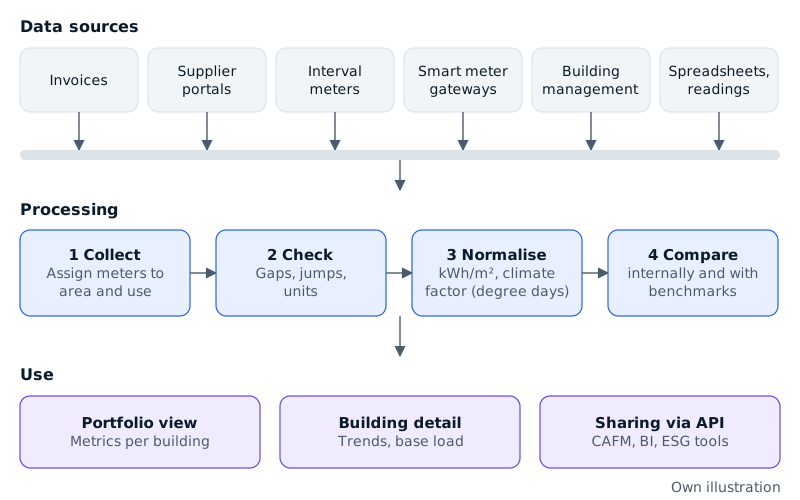 Figure 1: From scattered meter readings to a portfolio view – data sources and processing steps (own illustration). Sources: [1][2].
Annual, monthly or 15-minute data: what each can tell you
Time resolution decides which questions you can answer. Annual values allow a rough comparison between buildings. Monthly values show seasonal patterns and allow weather normalisation. Only 15-minute values show whether plant runs at night and at weekends, how high the base load is and when peaks occur.
Worked example (illustrative): data volume. A year has 365 days of 96 quarter-hours, so one interval meter delivers 35,040 values a year. Assumption: a portfolio has 40 sites, each with three meters read every 15 minutes. That gives 120 × 35,040 = around 4.2 million values a year. Spreadsheets cannot check this volume meaningfully; it needs a database with automatic validation rules.
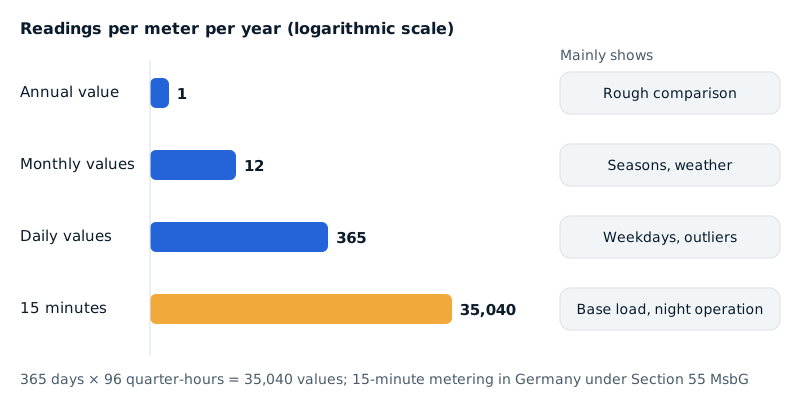 Figure 2: Readings per meter per year by time resolution and what they show (own calculation; 15-minute metering under Section 55 MsbG). Sources: [1].
What a usable portfolio energy view needs
A portfolio view is more than a chart with many lines. For facility and asset managers to base decisions on it, five building blocks have to be right.
1. Data sources and master data
Start with a list of all meters: main meters per energy type, sub-meters for tenant areas or plant, and the building and floor area each one serves. Use the same reference area across the portfolio. The German official rules for non-residential benchmarks use the sum of heated and cooled net floor areas; where only the heated and cooled gross floor area is known, it is converted with a factor of 0.85 [6]. Other countries and frameworks use other definitions, so record which one each building uses.
| Data source | Typical resolution | Availability | Typical weakness |
|---|---|---|---|
| Invoice (electricity, gas, heat) | Billing period, often 12 months | Weeks to months after period end | Periods differ, estimated readings, PDF instead of data |
| Supplier or grid operator portal | Monthly; 15 minutes for interval-metered sites | Depends on provider | Manual export, changing formats |
| Interval meter (in Germany: over 100,000 kWh electricity) | 15 minutes [1] | Daily to monthly | Access via third parties, link to the building often missing |
| Smart meter gateway | Metered-reading series, depending on equipment [1][2] | Depends on metering operator | Roll-out not yet complete |
| Building management system, sub-meters | Minutes to hours | Continuous, but local | Own data point names, gaps after outages |
| Spreadsheets, reading logs | Monthly or irregular | Delayed | Typing errors, meter changes not recorded |
Table 1: Typical sources of portfolio energy data (own compilation; resolutions under Sections 55 and 29 MsbG [1][2]).
2. Intervals and timeliness
For a portfolio overview, monthly values per building and energy type are a sufficient common basis. Where 15-minute values exist, add a detail view for base load and operating hours. All values must be aligned to calendar months: billing periods running from the 14th of one month to the 13th of the next are split pro rata and flagged as “apportioned”.
3. Energy use intensity (kWh/m²) and weather normalisation
Absolute consumption says little. A large building uses more than a small one, and a cold winter more than a mild one. Consumption is therefore converted into metrics.
Floor area: Dividing consumption by the energy reference area gives the energy use intensity (EUI) in kWh per square metre per year. The German guideline VDI 3807 Part 1 “Consumption characteristics for buildings – Fundamentals” (June 2013) describes how to derive such figures for heat, electricity and water from measured consumption, mainly to identify savings potential [8].
Weather normalisation: Only the space heating share depends on the weather. The German official method for non-residential buildings therefore first deducts hot water and thermally generated cooling and corrects only the heating share [6], using the climate factors of the German Weather Service (Deutscher Wetterdienst, DWD). A climate factor is the ratio of the degree days at the reference location Potsdam to the degree days at the building’s location. The DWD calculates it for around 8,200 postcodes and rolling twelve-month periods, with degree days derived from daily mean temperatures according to VDI 3807 [7]. Other countries publish their own degree-day data, but the logic is the same: correct the weather-dependent share, not the total. Software can automate the weather normalisation of energy data, but the method should stay transparent.
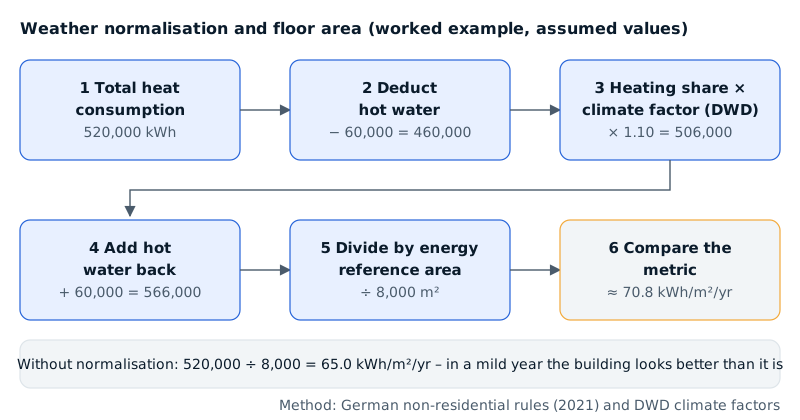 Figure 3: From raw consumption to a comparable metric – simplified weather normalisation following the German rules for non-residential buildings with DWD climate factors; figures from the worked example, assumed values (own illustration). Sources: [6][7].
Worked example (illustrative): weather normalisation. All figures are assumptions. An office building has an energy reference area of 8,000 m² and uses 520,000 kWh of heat in a year, of which an estimated 60,000 kWh is central hot water. The space heating share is 460,000 kWh. The year was mild; the climate factor for the postcode is an assumed 1.10. Normalised heating share: 460,000 × 1.10 = 506,000 kWh; with hot water added back, 566,000 kWh. Key figure: 566,000 ÷ 8,000 ≈ 70.8 kWh/m²/yr. Without normalisation it would be 65.0 kWh/m²/yr: in the mild year, the building would have looked better than it is.
4. Energy intensity benchmarking: internal and external
A metric needs a yardstick, and good energy intensity benchmarking in real estate always states which one and where it comes from. There are two kinds.
- Internal benchmarks: buildings with the same use in your own portfolio, the same building in the previous year, or before and after a measure. For energy management systems, ISO 50001 requires an energy baseline and energy performance indicators. A position paper by the German standards committee DIN NAGUS notes that simple ratio indicators often normalise poorly and names weather and occupancy as typical influencing factors [9].
- External benchmarks: In Germany, a joint notice of the federal economics and building ministries of 15 April 2021 sets benchmark values per building category for consumption-based energy performance certificates [6]. Investor frameworks bring their own thresholds; GRESB, for example, uses an energy use intensity threshold from ASHRAE 100:2024 in its energy efficiency scoring [21].
| Building category (German notice 2021) | Benchmark, heat | Benchmark, electricity |
|---|---|---|
| Office buildings | 57.1 kWh/m²/yr | 17.6 kWh/m²/yr |
| Schools | 71.7 kWh/m²/yr | 9.4 kWh/m²/yr |
| Hospitals (excluding research and teaching) | 104.9 kWh/m²/yr | 26.2 kWh/m²/yr |
Table 2: Examples of official German benchmark values, calculated from the partial energy values in the notice: heat = space heating + central hot water, electricity = ventilation + lighting; excluding cooling, auxiliary energy and other uses, before adjustment to building size [6].
Two limitations matter. The method adjusts the heat benchmark to the actual floor area; the table shows starting values for a reference size [6]. And the values are meant for energy performance certificates, not as targets for a specific building. Whether the notice will be updated after the switch to the Building Modernisation Act is worth checking with your energy consultant.
5. Data quality: validation rules before any analysis
Most misreadings start in the data, not in the analysis. Simple automatic rules help:
- Completeness: Are months or quarter-hours missing? Is a gap stored as a gap, not as zero?
- Plausibility: Negative consumption, jumps to several times the usual level or a meter reading running backwards point to a meter change, a counter overflow or a typing error.
- Units: Gas in m³ is converted to kWh with the calorific value and volume correction factor from the bill.
- Estimates: Keep estimated invoice readings flagged. GRESB asks for actual (non-estimated) data and allows estimates only under defined conditions [21].
- Double counting: Sub-meters must not be added on top of the main meter.
- Master data: Has the floor area changed after a refurbishment or through vacancy? The German rules provide separate adjustments for vacancy [6].
ESG data for real estate: CSRD, EU Taxonomy, CRREM and GRESB
General information, not legal advice (status: October 2026).
Energy data underpins almost every ESG metric for a building, and clean ESG data for real estate starts with the metered, normalised figures described above. Four frameworks matter most for portfolios; the regulatory ones changed considerably in 2025 and 2026.
CSRD and ESRS E1. Directive (EU) 2026/470 (“Omnibus I”) simplified sustainability reporting [13]. Only companies and groups with more than 1,000 employees and more than EUR 450 million net turnover are now to be in scope; member states must transpose the rules by 19 March 2027 [14]. The simplified European Sustainability Reporting Standards (ESRS) were adopted as Delegated Regulation (EU) 2026/1563, published in the Official Journal on 21 September 2026 and applying to financial years from 1 January 2027 [15]. The climate standard ESRS E1 still covers the sub-topic energy [15]. In Germany, the CSRD implementation act was, according to our research, still in parliament in summer 2026 [16]; check the current status before deciding.
EU Taxonomy, activity 7.7 (acquisition and ownership of buildings). For buildings built before 2021, a substantial contribution to climate change mitigation requires an energy performance certificate of class A or a place in the top 15% of the national or regional building stock. Large non-residential buildings with heating, ventilation or air-conditioning systems above 290 kW must also be operated efficiently through energy performance monitoring and assessment [12]. Ongoing monitoring is part of the criteria.
CRREM. The Carbon Risk Real Estate Monitor states that it provides more than 1,000 decarbonisation pathways for 44 countries, by country, property type and metric, aligned with a 1.5 °C scenario. The current version is 2.04 (August 2025); revised energy pathways are expected in the fourth quarter of 2027 [17]. Comparing a building with the CRREM pathways requires energy and emissions intensity per square metre, exactly the normalised figures from the previous section.
GRESB. In the 2026 GRESB Real Estate Assessment, operational energy (indicator EN1) is reported per asset for two consecutive years, split into fuels, district heating and cooling, and electricity, together with the floor area the data covers. Coverage is assessed by area and time, separately for landlord- and tenant-controlled space, and like-for-like comparisons need more than 355 days of data in both years [21]. Gaps in meter data show up directly as lower coverage.
| Framework | Energy data needed | Status (October 2026) |
|---|---|---|
| CSRD / ESRS E1 | Climate standard disclosures including energy; basis for emissions disclosures | Omnibus Directive (EU) 2026/470 in force; simplified ESRS from financial year 2027 [13][15]; German transposition open [16] |
| EU Taxonomy 7.7 | Energy performance certificate or primary energy demand; for large non-residential buildings, evidence of monitoring and assessment | Criteria as presented by the Commission [12]; check details with specialists |
| CRREM | Energy and emissions intensity per m² and year, per building | Version 2.04 (August 2025), revision announced [17] |
| GRESB (EN1) | Asset-level consumption by energy type for two years, floor area covered, data coverage | 2026 Real Estate Assessment [21] |
| EPBD Art. 13 / German GModG Section 56 | Continuous monitoring, logging and analysis; interoperability; open interface | EU: above 290 kW by end of 2024, above 70 kW by end of 2029 [20]; Germany: above 70 kW by end of 2029 [4] |
Table 3: Energy data in ESG frameworks and building law (own summary; general information, not legal advice).
Companies outside reporting scope may still have to supply data to partners who report, as landlords, tenants or borrowers; a clean data basis saves duplicate work. The roles stay separate: a monitoring platform supplies measured data and metrics, while the sustainability report, Taxonomy assessment or carbon footprint is produced by the company with its specialists and auditors.
Assets in Germany: interval data and the GModG monitoring duty
The EU Energy Performance of Buildings Directive (EPBD, Directive (EU) 2024/1275) requires member states to ensure, where technically and economically feasible, that non-residential buildings with heating, air-conditioning or combined systems above 290 kW have building automation and control systems by 31 December 2024, and those above 70 kW by 31 December 2029. The systems must continuously monitor, log and analyse energy use, benchmark efficiency, detect efficiency losses and, by 29 May 2026, monitor indoor environmental quality [20]. The transposition deadline for most of the directive was 29 May 2026 [20].
Germany shows what this looks like in national law. The Buildings Energy Act (Gebäudeenergiegesetz, GEG) was restructured in 2026 into the Building Modernisation Act; the Bundestag passed the amendment on 10 July 2026 [5], and the new name has applied since 29 July 2026. Section 56 GModG requires non-residential buildings whose heating, air-conditioning or combined ventilation system has a rated output above 70 kW to have a building automation and control system by 31 December 2029, where technically possible and economically reasonable [4]. The previous rule, Section 71a GEG, had set the threshold at 290 kW [19]. Among other things, the system must continuously monitor, log and analyse the consumption of all main energy types, make the data accessible through a common, freely configurable interface, set efficiency values, detect efficiency losses and monitor indoor climate quality [4]. The duty will therefore reach smaller non-residential buildings too; whether their data ends up in one portfolio view is a question of integration.
Two more German rules matter. Interval metering under the MsbG means many larger sites already have 15-minute electricity data (Table 1) [1]. And companies with average annual final energy consumption above 7.5 GWh must run an energy or environmental management system that records energy flows, under Section 8 of the Energy Efficiency Act (Energieeffizienzgesetz, EnEfG) [10].
Energy management software for multiple sites: neutral selection criteria
Offerings differ widely. Rather than comparing products, use questions you can put to any provider. The first criterion is usually decisive: energy management software for multiple sites is only as good as the range of data it can take in.
| Criterion | How to recognise it | Why it matters |
|---|---|---|
| Data connectivity | Imports from invoices and portals, interval and smart meter data, building management systems, own sensors | Without it, the portfolio stays patchy |
| Open interfaces | Documented API, export in common formats, no lock-in to one manufacturer’s hardware | EPBD and Section 56 GModG require interoperability and an open interface [4][20]; data must reach CAFM, BI and ESG tools |
| Master data model | Buildings, floor areas, uses, meter hierarchy and meter changes can be modelled | Basis of every metric |
| Data quality | Automatic validation rules, flags for gaps, estimates and corrections | Prevents misreadings |
| Normalisation | Floor area, weather normalisation with published degree-day data, traceable calculation | Comparability across years and sites [6][7] |
| Benchmarks | Internal comparisons, external benchmarks stored with their source | Assessment, not just display |
| Roles and permissions | Separate views for facility management, asset management and tenants | Data protection and clarity |
| Traceability | Change history, origin of every value | Auditability for reports and assurance |
| Operation and cost | Licence model, maintenance effort, hosting location | Ongoing data upkeep often costs more than the software |
Table 4: Neutral criteria for choosing portfolio energy management software (own compilation).
Energy data should not end up in yet another isolated system. If facility management already uses a CAFM system, consumption and other building data should arrive where the work is organised; indoor climate data in CAFM is one example.
What does monitoring deliver? The research evidence
Robust figures for Germany are rare. A widely cited US analysis comes from Lawrence Berkeley National Laboratory: Kramer and colleagues (2019, Energy Efficiency) evaluated a campaign with energy management and information systems covering more than 400 million square feet. Participants who reported savings achieved a median of 7% a year; systems with automated fault detection saved more than pure energy information systems [18]. The limits: participants volunteered, the figure covers only those who reported savings, and the buildings are in the US. It indicates an order of magnitude, not a promise for any portfolio.
Common mistakes in portfolio energy monitoring
- Starting with the dashboard, not the master data. A polished building energy dashboard with wrong meter assignments creates false certainty.
- Not apportioning billing periods. Treating billing periods as calendar years compares different winters.
- Normalising total heat. Hot water does not depend on the weather; applying the climate factor to everything distorts the figure [6].
- Mixing floor area definitions. Lettable, gross and net floor area give different metrics.
- Storing gaps as zero. A failed data logger then looks like an economical month.
- Using benchmarks as targets. They show where a building stands, not what is technically possible.
- Collecting without acting. Without people who check anomalies and trigger action, monitoring has no effect, which is why the EPBD and Section 56 GModG require the system to inform the operator about efficiency improvements [4][20].
- Keeping ESG data separately. A separate spreadsheet for the sustainability report soon means two versions of the truth.
Step by step to a portfolio overview
- Inventory: list all meters, contracts, portals and floor areas; name a person responsible per site.
- Minimum data set: monthly values per building and energy type, one floor area definition, type of use.
- Automate: connect interval and smart meter data, building management systems and existing sensors instead of retyping.
- Validate: completeness, plausibility, units.
- Normalise and compare: EUI in kWh/m²/yr, weather normalisation, internal and external benchmarks.
- Act on anomalies: base load, operation outside occupied hours, deviations from last year; document results.
- Share: deliver data via interfaces to CAFM, BI and ESG tools.
How Nebatic helps
Nebatic starts with the data basis. The platform can connect existing meters, sensors and building systems and analyse them together with Nebatic’s own indoor climate devices. For portfolios, it shows live values, trends and alerts on anomalies per site, with building-level views of consumption and base load. Interval and smart meter data from commercial sites and building management systems can be connected.
Via APIs, the data flows into software you already use, such as CAFM, BI or ESG tools; the building data API describes how. Where standard views do not fit, dashboards can be developed with your team. The facility management page covers the operator’s side.
Nebatic supplies data and analysis. It does not produce official ESG reports, Taxonomy evidence or carbon footprints; these stay with your company, your advisers and your auditors.
Limits and risks
Portfolio monitoring shows where and when energy is used, not automatically why. Whether a high base load comes from a badly set ventilation system, server rooms or tenant behaviour has to be clarified on site by plant operators, building services engineers or specialist contractors.
Metrics and benchmarks are for orientation. They replace neither an energy performance certificate nor an energy audit. For renovation roadmaps and funding, energy consultants and national programmes (in Germany, BAFA and KfW) are the right contacts; the funding body decides on funding.
Legal questions, such as whether a company falls under the CSRD, whether a building meets the Taxonomy criteria or whether Section 56 GModG applies, belong with lawyers, auditors or specialist ESG advisers. The framework changed several times in 2026, and more changes have been announced [5][16][17].
Finally, data protection: 15-minute values from tenant areas can reveal when people are present. Decide who may see which data, and involve your data protection officer early.
Frequently asked questions
What is multi-site energy monitoring?
It brings the consumption data of several buildings together in one place, checks it and makes it comparable through metrics such as kWh/m²/yr. It pays off most for portfolios with several locations, different suppliers and at least some buildings with interval or sub-meter data.
How do you benchmark energy use across a real estate portfolio?
Convert consumption into energy use intensity per square metre with one floor area definition, weather-normalise the heating share, then compare buildings of the same use with each other, with their own previous years and with external benchmarks [6][7][8]. Always state which benchmark you use.
How do you weather-normalise building energy data?
Separate the weather-dependent space heating share from hot water and process energy, correct only that share with degree-day data for the building’s location, then add the other shares back [6][7]. Correcting total heat distorts the result.
Can I monitor a portfolio with only annual energy bills?
Yes: annual bills are enough to calculate and weather-normalise kWh/m²/yr [6][7], but not to find causes or check operating hours. Monthly readings, portal exports or connecting existing sub-meters are sensible next steps.
What energy data do CSRD and the EU Taxonomy require for buildings?
Energy consumption per building and energy type, the energy reference area and information from the energy performance certificate. For large non-residential buildings, the Taxonomy also requires energy performance monitoring and assessment [12]. What a company must report depends on its scope, which changed in 2026 [13][14] (general information, not legal advice).
What energy data does GRESB ask for?
For the 2026 Real Estate Assessment: asset-level operational energy for two consecutive years by energy type, the floor area covered and data coverage over time, separately for landlord- and tenant-controlled space [21]. Actual meter data is expected; estimates only under defined conditions.
How do you keep a building energy dashboard from becoming overloaded?
Use levels: the portfolio with a few metrics per building at the top; the individual building with monthly trends and a year-on-year comparison below; load profiles and plant data for root-cause analysis at the bottom. Each level answers one question for one role, such as asset management, facility management or engineering.
Sources
- Federal Ministry of Justice / Federal Office of Justice: Metering Point Operation Act (Messstellenbetriebsgesetz, MsbG), Section 55 Collection of electricity measurement values. https://www.gesetze-im-internet.de/messbg/__55.html
- Federal Ministry of Justice / Federal Office of Justice: Metering Point Operation Act (MsbG), Section 29 Equipping metering points with smart metering systems and modern metering devices. https://www.gesetze-im-internet.de/messbg/__29.html
- Federal Ministry of Justice / Federal Office of Justice: Heating Costs Ordinance (Heizkostenverordnung, HeizkostenV), Section 6a Billing and consumption information. https://www.gesetze-im-internet.de/heizkostenv/__6a.html
- Federal Ministry of Justice / Federal Office of Justice: Building Modernisation Act (Gebäudemodernisierungsgesetz, GModG), Section 56 Building automation and building control. https://www.gesetze-im-internet.de/geg/__56.html
- Federal Ministry for Economic Affairs and Energy (2026): Information on the adoption of the Building Modernisation Act (published by Amt Berkenthin, July 2026). https://berkenthin-amt.de/wp-content/uploads/2026/07/BMWE-informiert-ueber-Beschluss-Gebaeude-Modernisierungsgesetz.pdf
- Federal Ministry for Economic Affairs and Energy / Federal Ministry of the Interior, Building and Community (2021): Notice on the rules for energy consumption values and the benchmark values for existing non-residential buildings of 15 April 2021 (BAnz AT 03.05.2021 B1). https://www.gebaeudeforum.de/fileadmin/gebaeudeforum/Downloads/Rechtsvorschrift/2021-04-15_Bekanntmachung_Energieverbrauchswerte_NWG.pdf
- Deutscher Wetterdienst (2023): Climate factors for energy consumption certificates, data set description v22.3. https://opendata.dwd.de/climate_environment/CDC/derived_germany/techn/monthly/climate_correction_factor/recent/BESCHREIBUNG_derivgermany_techn_monthly_climate_correction_factor_recent_de.pdf
- VDI (2013): VDI 3807 Part 1 – Consumption characteristics for buildings – Fundamentals (June 2013 edition). https://www.dinmedia.de/en/technical-rule/vdi-3807-blatt-1/180189525
- DIN Standards Committee Principles of Environmental Protection (NAGUS), NA 172-00-09 AA (2020): Determining and presenting the improvement of energy performance according to ISO 50001:2018, version 2. https://www.umweltbundesamt.de/system/files/medien/1/dokumente/exkurs_-_bestimmung_und_darstellung_der_verbesserung_der_energiebezogenen_leistung.pdf
- Federal Ministry of Justice / Federal Office of Justice: Energy Efficiency Act (Energieeffizienzgesetz, EnEfG), Section 8 Establishing energy or environmental management systems. https://www.gesetze-im-internet.de/enefg/__8.html
- Deutsche Energie-Agentur (dena) (2026): dena Building Report 2026, update report April 2026. https://www.dena.de/fileadmin/dena/Publikationen/PDFs/2026/GR_Update_April26.pdf
- European Commission, D. Barglazan (2022): EU Taxonomy – Technical screening criteria for buildings (presentation). https://energyefficientmortgages.eu/wp-content/uploads/2022/03/EUTaxonomy-TSC-for-buildings-Diana-Barglazan-European-Commission.pdf
- European Parliament and Council (2026): Directive (EU) 2026/470 of 24 February 2026 amending Directives 2006/43/EC, 2013/34/EU, (EU) 2022/2464 and (EU) 2024/1760. https://eur-lex.europa.eu/eli/dir/2026/470/oj
- KPMG Austria (2026): Omnibus I published with simplifications (Reporting News 02/2026). https://kpmg.com/at/de/media/newsletter/reporting-news/2026/02/rn-omnibus-1-mit-vereinfachungen-veroeffentlicht.html
- European Commission (2026): Delegated Regulation (EU) 2026/1563 of 3 July 2026 amending Delegated Regulation (EU) 2023/2772 (simplified ESRS). https://eur-lex.europa.eu/eli/reg_del/2026/1563/oj
- PwC Germany (2026): Current developments in transposing the CSRD into German law (Accounting and Reporting Blog, 14 April 2026). https://blogs.pwc.de/de/accounting-and-reporting/article/254119/aktuelle-entwicklungen-zur-umsetzung-der-csrd-in-deutsches-recht/
- CRREM – Carbon Risk Real Estate Monitor (2025/2026): Global Pathways and Pathway Explorer. https://crrem.org/
- Kramer, H.; Lin, G.; Curtin, C.; Crowe, E.; Granderson, J. (2019): Building analytics and monitoring-based commissioning: industry practice, costs, and savings. Energy Efficiency. Lawrence Berkeley National Laboratory. https://eta-publications.lbl.gov/publications/building-analytics-and-monitoring
- lxgesetze.de: Buildings Energy Act (Gebäudeenergiegesetz, GEG), Section 71a Building automation (version before the Building Modernisation Act). https://lxgesetze.de/geg/71a
- European Parliament and Council (2024): Directive (EU) 2024/1275 of 24 April 2024 on the energy performance of buildings (recast), Article 13(9)–(10) and Article 35. https://eur-lex.europa.eu/eli/dir/2024/1275/oj
- GRESB (2026): 2026 Real Estate Assessment – EN1: Operational Energy (reference guide). https://guides.gresb.com/completingassessments/2026-real-estate-assessment/re/perf/en/en1-operational-energy