This article frames the retrofit decision around EU rules and uses Germany as the worked case (data, funding, the Building Modernisation Act, Gebäudemodernisierungsgesetz, GModG); other EU countries implement the EU directive in their own laws.
Key points
- In an energy retrofit of a commercial building, measured operating data should decide which measure comes first; calculated values reflect use, controls and operating hours only roughly.
- The pressure is rising. Under the recast EU Energy Performance of Buildings Directive (EPBD), all non-residential buildings must be below a national “16% threshold” from 2030 and a “26% threshold” from 2033 [20]. Investors use tools such as CRREM to assess the stranding risk of buildings and portfolios [21].
- Calculated demand and measured consumption often differ. A German field study of non-residential buildings found that calculations tend to overestimate the consumption of unrenovated buildings and underestimate that of efficient ones [7].
- Measuring before a retrofit should cover at least one heating season, with room temperatures, humidity, CO₂, occupancy, load profiles and base load.
- After the works, a before-and-after measurement using recognised methods (IPMVP, ISO 50015) shows the actual effect [17][18]. Measured data do not replace engineering design or an energy audit.
Why the energy retrofit of commercial buildings has become an investment question
An energy retrofit of a commercial building ties up capital for decades, and the regulatory clock is now running. The recast EPBD (Directive (EU) 2024/1275) requires member states to set minimum energy performance standards for non-residential buildings: each country defines, based on its non-residential stock on 1 January 2020, a “16% threshold” (16% of the national non-residential stock lies above it) and a “26% threshold”. All non-residential buildings must be below the 16% threshold from 2030 and below the 26% threshold from 2033 [20]. In effect, the worst-performing 16% of each national non-residential stock (measured against the 2020 baseline) has to be brought below the first threshold by 2030, and the worst 26% below the second by 2033; buildings that a member state exempts are excluded from the baseline [20].
Investors look at the same risk. The Carbon Risk Real Estate Monitor (CRREM), funded under the EU’s Horizon 2020 programme, developed science-based decarbonisation pathways for building types and an Excel tool for assessing the stranding risk of buildings or whole portfolios. According to the EU agency CINEA, it helps investors avoid investments that “might strand in the future due to stricter environmental policies” [21]. For asset managers, CRREM stranded assets analysis therefore depends on credible energy data for each building.
Germany as a case: the size of the task
According to the dena Building Report 2024, buildings account for around 30% of greenhouse gas emissions in Germany [1]. The “buildings” sector of the national emissions inventory, which excludes electricity and district heating, emitted around 112 million tonnes of CO₂ equivalent in 2022 [1].
Non-residential buildings (offices, retail, hotels, schools, warehouses, workshops) use more than a third of all final energy in the building sector [2]. The German Energy Agency (dena) reports more than 21 million non-residential buildings in Germany in 2015, of which about 2 million are relevant in energy terms [2].
These figures come from ENOB:dataNWG, a nationally representative sample collected by the Institute for Housing and Environment (IWU) with the IÖR and the University of Wuppertal [3]: around 21.1 million non-residential buildings in total, more than two thirds of them unheated structures such as garages, sheds or garden houses. About 1.98 million buildings are relevant in energy terms under the then Buildings Energy Act (Gebäudeenergiegesetz, GEG, since renamed the Building Modernisation Act, GModG) [3]. Their gross floor area is around 3.5 billion m², an average of about 1,765 m² per building [4].
Offices and administrative buildings alone number around 329,000 (end of 2022) [2]. About 62% were built by 1978, before Germany’s first thermal insulation regulation, and they account for around half of all office floor area [2]. Office energy use was 86.6 TWh, of which 55.3 TWh was for space heating and hot water [2].
The pace of renovation is too slow. According to ENOB:dataNWG, the building envelope of non-residential buildings has been upgraded at about 0.7% per year since 2010, and at about 1.1% for buildings from before 1978 [3]. About 2% of facade area per year is repaired without adding insulation [3], which the authors see as a missed opportunity. Heat generators are replaced at around 2.3% per year, but where gas was used before, a new gas boiler was installed in around 80% of cases [3].
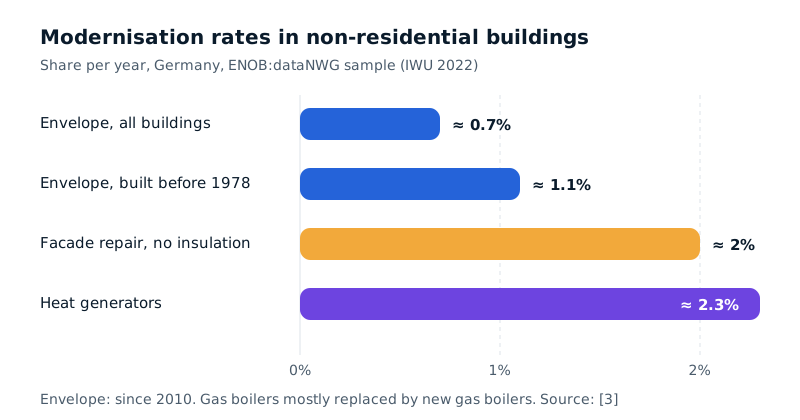
Figure 1: Modernisation rates in the German non-residential building stock (sample, with standard errors). Sources: IWU, ENOB:dataNWG final report 2022 [3].
Many commercial buildings therefore face decisions on envelope, heating and ventilation in the coming years, decisions that bind capital for decades.
The energy performance gap: why calculations and operation differ
In Germany, the energy design of non-residential buildings relies on calculations under DIN V 18599. These use standardised usage profiles: typical operating hours, setpoint temperatures, air change rates and internal loads. That is sensible for comparing options, but it does not automatically reflect how a specific building is actually used.
What the research says
The difference between calculated and measured energy performance is known as the energy performance gap. In 2014, Pieter de Wilde (University of Plymouth) proposed a framework for investigating it systematically in the journal Automation in Construction [5]. In a companion paper for the CIBSE ASHRAE Technical Symposium, de Wilde and Jones name causes such as occupant behaviour, weather, construction and installation faults, control settings and modelling issues [6]. Citing other sources, they put the size of the gap at a factor of about 1.5 to 2 [6].
In their own case study, a university building in Plymouth, measured heating gas use over two years was around 2.4 to 3.2 times the simulated value; rerun with actual weather and observed use, the model came within about 40% of the meter readings [6]. A single case, but it shows the mechanism: much of the gap comes from assumptions about use and operation.
German field data on non-residential buildings
For the German stock, the IWU compared calculated demand and measured consumption in non-residential buildings in its “Teilenergiekennwerte” project [7]. The cross-sectional analysis covers 92 building datasets in six categories. For heating and hot water, calculated demand in inefficient buildings was clearly above measured consumption. In efficient buildings, consumption tended to be underestimated [7].
When building-specific rather than standard usage conditions were used, the ratio of demand to consumption for fuels and district heating averaged 1.11 (± 0.28), and about 61% of cases were within ± 20% [7]. Outliers with a factor of 2 or more remained. Reasons given by the study include higher room temperatures in well-insulated buildings, weather and vacancy not corrected for, and assumptions about window ventilation [7].
A similar pattern is known from housing. Using data from around 3,400 German dwellings, Sunikka-Blank and Galvin found in 2012 that measured heating energy use was on average about 30% below the calculated rating, with a larger gap in particularly inefficient buildings (the “prebound effect”) [8]. It concerns housing and cannot be transferred directly to commercial property, but points the same way: savings forecasts based purely on calculated values can be too high.
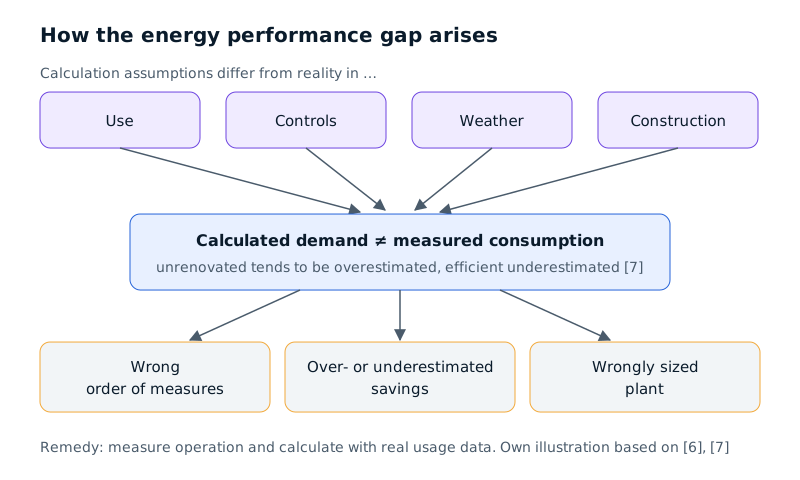
Figure 2: How the energy performance gap arises and why it affects the order of retrofit measures. Own illustration based on [6] and [7].
What goes wrong when retrofits are planned on paper
Planning on calculated values alone risks three wrong decisions.
The wrong order. If a building is fully heated and ventilated at night and at weekends, the big lever is the controls, not the facade. Conversely, a poorly insulated but frugally run building can look far worse on paper than its consumption shows.
Overestimated savings. If current consumption is already below calculated demand, the real saving will be smaller than forecast, which affects the business case and investors’ expectations.
Wrongly sized plant. New heat generators and ventilation systems often carry safety margins; without measured load profiles and room data, there is no basis for questioning them.
Other typical mistakes are:
- Measuring only in summer or only for a few days, which says nothing about heating behaviour.
- Using annual consumption without the weather and vacancy correction that the IWU explicitly recommends [7].
- Ignoring indoor climate: a tighter envelope changes air exchange, so ventilation has to be planned alongside.
- No baseline: without measurement before the works, the effect afterwards can hardly be proven.
Commercial building energy audit: what to measure before a retrofit
A commercial building energy audit usually starts with plans, a site visit and utility bills. International owners often know the ASHRAE audit levels: ASHRAE Standard 211, “Standard for Commercial Building Energy Audits”, aims to establish consistent practices for conducting and reporting energy audits and defines the procedures for Level 1, 2 and 3 audits [22][23]. ASHRAE describes the levels as shorthand for the depth of an audit [22]. At any level, measuring adds what documents cannot show: when the building is used, how warm and well ventilated rooms are, and what energy is used outside occupied hours.
Indoor climate: temperature, humidity and CO₂
Room temperatures in representative rooms show whether rooms are overheated or under-supplied, whether night setback works and how quickly rooms warm up in the morning. This matters directly for sizing a heat pump and for identifying problem zones.
Relative humidity helps assess mould risk, especially before replacing windows or sealing the envelope.
CO₂ concentration is an indicator of air exchange during occupancy. The German Committee on Indoor Air Guide Values at the Federal Environment Agency rates values below 1,000 ppm as hygienically harmless, 1,000 to 2,000 ppm as hygienically conspicuous and above 2,000 ppm as hygienically unacceptable [19]. If measurements in meeting rooms or open-plan offices regularly show high values, that is an argument for mechanical ventilation. An office ventilation retrofit for indoor air quality should therefore start by measuring the current situation.
Use and occupancy
Occupancy data, for example from CO₂ curves, booking systems or presence detection, show how many people are in the building and when, which areas are empty, and whether heating and ventilation match actual use. Since working patterns changed, occupancy often differs from the original design assumptions.
Load profiles and base load
Load profiles for electricity, heat and, where relevant, cooling at hourly or 15-minute resolution show when energy is used. For non-residential buildings, the IWU recommends load profile measurements of at least two weeks covering all weekdays and a weekend, ideally once in summer and once in the heating season [7].
The base load is consumption without use: servers, ventilation running continuously, circulation pumps, lighting, standby. It is often the quickest pointer to savings without construction work.
Worked example (illustrative; assumptions): An office is used Monday to Friday from 7:00 to 17:00, i.e. 50 hours a week. A week has 168 hours, so 118 hours, around 70% of the time, are outside occupied hours. If a ventilation system with an assumed electrical input of 5 kW runs continuously, 118 h × 5 kW = 590 kWh per week fall outside occupied hours. The figures are chosen freely for illustration only. Whether operation can be reduced depends on hygiene, humidity and operating requirements and must be checked by a specialist.
How long to measure
For heating and envelope questions, measure for at least one heating season (typically October to April in Germany) to capture cold spells, shoulder seasons and holidays. A base load analysis may need only a few weeks; summer comfort and cooling need an extra measurement in warm months. Consumption data should be corrected for weather and vacancy before comparing them with calculated demand [7].
Setting retrofit priorities with data
A proven logic: optimise operation first, then adapt the plant, then improve the envelope, with envelope and plant designed to match. This is not a fixed rule. If facade repairs are due anyway, insulation should be added at the same time, as the ENOB data on facades repaired without insulation show [3].
The table is a guide; actual costs and savings depend on the building and must be determined by engineers or energy auditors.
| Measure | Typical effect | Investment level (qualitative) | Data that decide |
|---|---|---|---|
| Adjust operating hours and controls (heating curve, setback, schedules) | Reduces consumption outside occupied hours | Low | Load profiles, base load, room temperatures at night and weekends, occupancy |
| Hydraulic balancing, pump replacement | More even heat distribution, lower system temperatures possible | Low to medium | Room temperatures per zone, flow and return temperatures |
| Demand-controlled ventilation | Airflow follows occupancy | Medium | CO₂ curves, occupancy, operating hours of the system |
| Retrofit mechanical ventilation | Better air exchange, enables heat recovery | Medium to high | CO₂ and humidity during occupancy, room use, space for ducts |
| Heat pump instead of fossil boiler | Lower emissions; efficiency depends on system temperature | High | Measured heating load, required flow temperatures, room temperatures in critical rooms |
| Window replacement | Less heat loss and fewer draughts | Medium to high | Room temperatures at facades, humidity (mould risk after replacement) |
| Insulating roof, facade, basement ceiling | Permanently lowers heating load | High | Weather-corrected consumption, demand vs consumption check, repairs due anyway |
| Lighting and controls | Lowers electricity use | Low to medium | Electricity profile, operating hours, occupancy |
Table 1: Priority logic for the energy retrofit of non-residential buildings. Qualitative assessment, no cost figures.
Energy indicators should not be the only yardstick: if a building becomes more efficient but its rooms are less well ventilated or too warm in summer, new problems arise.
From audit to retrofit roadmap: the German funding example
A retrofit roadmap sequences measures so that they build on each other. Germany funds this through the “Federal Funding for Energy Advice for Non-Residential Buildings, Plant and Systems” (Bundesförderung für Energieberatung für Nichtwohngebäude, Anlagen und Systeme, EBN) run by the Federal Office for Economic Affairs and Export Control (BAFA) [9]. It has three modules:
- Module 1: energy audit to EN 16247
- Module 2: energy advice to DIN V 18599
- Module 3: advice on energy performance contracting [9]
Module 2 has two variants [10][11]. A renovation roadmap (Sanierungsfahrplan) shows how a building can be comprehensively renovated “step by step over a longer period through coordinated measures” [11]. Alternatively, the advice describes a renovation in one go to the standard of a federally funded efficiency building [11]. According to the programme description, eligible applicants include municipalities, non-profit organisations, small and medium-sized enterprises and larger companies with total energy consumption of no more than 500,000 kWh per year [10]. The description refers to the guideline as amended on 23 December 2024 [10]. Eligibility and amounts are checked by BAFA and an accredited energy adviser; conditions can change (current status on the BAFA website [9]). Other EU countries have their own schemes.
Operational data do not replace an energy audit, but give it a better starting point: load profiles, room temperatures and occupancy data from a heating season allow a calculation with building-specific usage conditions, which the IWU showed brings demand and consumption much closer together [7]. For owners and operators with several buildings, it pays to collect these data early across the portfolio.
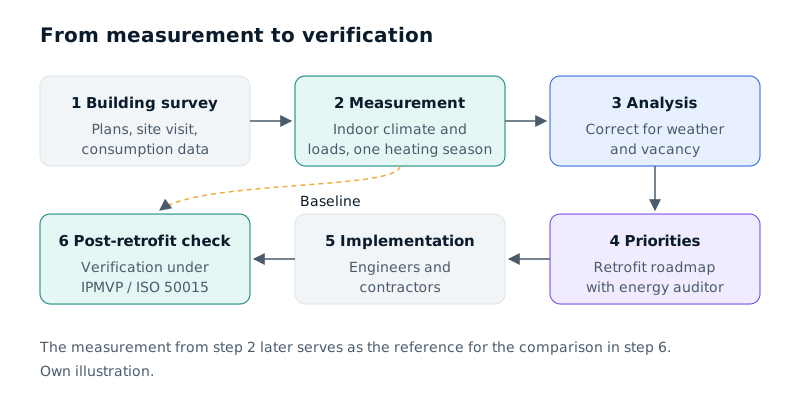
Figure 3: From measurement to verification: one possible sequence for a data-led retrofit. Own illustration.
Heat pump retrofit in commercial buildings: plan with room data
For many commercial buildings, the heat pump is a key option. Its efficiency depends strongly on the temperature to which it has to heat the water: the smaller the gap between heat source and required flow temperature, the less electricity the heat pump needs per kilowatt-hour of heat.
Fraunhofer ISE studied this in the “WPsmart im Bestand” field test. Of all the factors examined, only the heating circuit temperature showed a clear relationship with the seasonal performance factor (SPF) [12]. The researchers call the required heating circuit temperature the decisive point for efficiency [12]. In the follow-up project with 77 heat pumps, air-to-water units reached an average SPF of 3.4 and brine-to-water units 4.3. Adequately sized radiators could on average be run at similarly low temperatures to underfloor heating [13].
These field tests concern one- to three-family homes [13]; commercial buildings add larger outputs, different usage profiles, ventilation heating coils and often cooling. For large commercial heat pumps, the German guideline VDI 4646 “Application of large heat pumps” (May 2026) addresses designers and users of systems usually above 100 kW thermal output [14].
For a heat pump retrofit in a commercial building, measured data help because they show:
- which rooms or zones already get warm at low flow temperatures and which do not,
- the actual heating load on cold days, not only the calculated design heat load,
- whether a few critical rooms (corner rooms, large glazed areas) dictate the flow temperature for the whole building,
- how occupancy times affect warm-up phases and peak loads.
This allows targeted measures, such as larger emitters in a few rooms, instead of a high flow temperature for the whole system. Monitoring stays useful after commissioning.
Retrofit or rebuild: what the data say about embodied carbon
For very old or heavily altered buildings, the question is deep energy retrofit or new build. Besides operational energy, this concerns embodied energy and the emissions that arise from manufacturing, transporting and installing components.
In 2021, the German Sustainable Building Council (DGNB) analysed the construction emissions of 50 certified buildings, 46 of them offices [16]. Construction emissions averaged around 440 kg CO₂ equivalent per m². For conventional new buildings, the DGNB cites about 500 to 800 kg CO₂ equivalent per m² over a 50-year life cycle [16]. The DGNB recommends checking, before building new, whether an existing building can be renovated for climate-neutral operation, because large amounts of emissions are already bound in the existing stock [16].
A study for the German Federal Environment Agency (TEXTE 71/2025) concludes that renovating existing buildings, including a new heat supply, involves lower cumulative energy demand than new construction [15]. It also stresses renovation depth: raising the renovation rate without sufficiently improving thermal insulation risks lock-in effects. For new buildings it recommends the highest efficiency [15]. Repair, replacement and conversion were not considered [15].
No general verdict follows. The choice depends on structure, use requirements, hazardous materials, layout and location; measured data show how well the existing building performs today and provide the baseline for later verification.
| Criterion | Points towards retrofit | Points towards new build | Who assesses |
|---|---|---|---|
| Structure | Intact, flexible to use | Damaged, not adaptable | Structural engineer |
| Embodied emissions | Existing building already binds emissions [16] | New construction creates new emissions | Life cycle assessment (LCA) |
| Operation after works | Target level achievable by retrofit | Target level only achievable by new build | Energy adviser, building services engineer |
| Use requirements | Layout fits future use | Use requires a fundamentally different building | Architect, developer |
| Hazardous materials | Minor or remediable | Extensive contamination | Specialist survey |
Table 2: Criteria for weighing retrofit against new build. Qualitative, not a general recommendation.
Measurement and verification: proving energy savings after a retrofit
A retrofit is only really assessed once its effect has been measured in operation, using established measurement and verification (M&V) methods. Measurement and verification of energy savings turns a forecast into evidence that owners and investors can check.
The International Performance Measurement and Verification Protocol (IPMVP) of the Efficiency Valuation Organization (EVO), currently in its 2022 edition, is a non-prescriptive framework: savings are determined by comparing consumption before and after the measure and adjusting for changed conditions [17]. The protocol distinguishes options with a measurement boundary around the individual measure (Options A and B), around the whole building (Option C) or based on calibrated simulation (Option D) [17].
ISO 50015:2014 “Energy management systems – Measurement and verification of energy performance of organizations – General principles and guidance” sets out general principles for M&V of energy performance; it was reviewed and confirmed in 2025 [18].
In practice:
- Set the baseline: consumption and indoor climate before the works, over a representative period.
- Record influencing factors: weather (degree days), occupancy, operating hours, changes of use.
- Choose the measurement boundary: a single system or the whole building, depending on the measure.
- Measure afterwards: same points, comparable period, same adjustments.
- Check indoor climate too: has air quality improved, is there new overheating or moisture?
Without a baseline the comparison stays incomplete, so the pre-retrofit measurement should be designed from the start as the later reference.
How Nebatic helps
In audit and analysis, Nebatic offers measurements over an agreed period followed by analysis and recommendations, for example before a retrofit or as a before-and-after measurement. Depending on the model, its own devices record CO₂, particulate matter, volatile organic compounds (VOC), temperature and humidity; the Nebatic Core model also records light and sound. Existing sensors, meters and building systems can be connected, so that room data and consumption data are analysed together.
The platform shows live values, trends, anomalies, notices and reports, which can give architects, engineers and energy consultants an additional data basis. The results do not replace engineering design, an energy audit carried out under the rules of the relevant funding body (in Germany, BAFA) or an assessment by qualified experts. For office buildings, see also the page on offices.
Limits and risks
Measured data improve decisions; they do not make them.
- Representativeness. Individual rooms do not automatically stand for the whole building; the choice of rooms must be justified.
- Period. A single heating season can be untypical (mild winter, vacancy), so weather correction and documentation of use are needed.
- No diagnosis of building elements. Indoor climate data show symptoms such as cold rooms or high humidity. Causes in the fabric, such as thermal bridges or moisture damage, are established by thermography, opening up elements or expert surveys.
- No structural or hazardous materials assessment. Retrofit-or-rebuild needs a structural engineer and, where relevant, a hazardous materials survey.
- Funding. Whether a measure is eligible for funding is decided case by case by the funding body (in Germany BAFA or KfW). Advice comes from an accredited energy adviser.
- Legal requirements. Requirements under building energy law (in Germany the Building Modernisation Act, GModG, formerly the Buildings Energy Act) and workplace rules apply regardless of measurement results. General information, not legal advice (status: October 2026).
- Health. CO₂ values are an indicator of air exchange, not a health assessment. If employees have complaints, the occupational health physician is the right contact.
Frequently asked questions
What should a building survey before a retrofit include?
A survey of an existing building covers documents (plans, energy performance certificate, maintenance records), a site visit, consumption data from recent years and, ideally, measurement during operation. For non-residential buildings, the IWU recommends, among other things, occupant surveys, short-term room temperature measurements and load profiles over at least two weeks [7].
How long should you measure before an energy retrofit?
For heating and envelope questions, at least one heating season. For base load or operating hours, a few weeks can be enough, provided all weekdays and a weekend are included [7]. Summer overheating needs a measurement in the warm months.
What is the energy performance gap?
It is the difference between calculated and measured energy performance. De Wilde and Jones cite a gap of a factor of about 1.5 to 2 from other sources; in their own case study, measured heating gas use was 2.4 to 3.2 times the simulation [6]. German field data show that unrenovated buildings tend to be overestimated and efficient ones underestimated [7].
How do you prioritise measures in a commercial building energy retrofit?
The sequence operation, plant, envelope has proven itself. First adapt controls and operating hours to actual use, then plant such as heat generation or ventilation, matched to the planned envelope. If facade or roof repairs are due anyway, insulation should be planned at the same time [3].
What do the EPBD minimum energy performance standards mean for non-residential buildings?
Member states set national thresholds based on their non-residential stock. All non-residential buildings must be below the 16% threshold from 2030 and below the 26% threshold from 2033 [20]. How this is implemented, including exemptions, depends on national law.
Is a heat pump worthwhile in a commercial building?
That depends above all on the required flow temperature. Fraunhofer ISE field tests in homes show that the heating circuit temperature is the most important factor for efficiency [12]. For a commercial building, measured room temperatures and load profiles help identify critical rooms and the actual heating load. In Germany, VDI 4646 covers large systems [14].
How can energy savings after a retrofit be proven?
With a before-and-after measurement using a recognised method such as the IPMVP or ISO 50015 [17][18], with a clean baseline, adjustment for weather and use, and the same measurement points before and after.
Sources
- Deutsche Energie-Agentur (dena) (2023): DENA-Gebäudereport 2024. Zahlen, Daten, Fakten zum Klimaschutz im Gebäudebestand (facts and figures on climate protection in the building stock, in German). https://co2.hessen-nachhaltig.de/files/content/downloads/dena-Gebaedereport_2024.pdf
- Deutsche Energie-Agentur (dena) (2023): Fokusthema Büro- und Verwaltungsgebäude. Analyse der Nichtwohngebäudetypen, Teil 2 (focus on office and administrative buildings, in German). https://www.gebaeudeforum.de/fileadmin/gebaeudeforum/Downloads/Gebaeudereport/Gebaeudeforum_GR24_Fokusthemen_Buerogebaeude.pdf
- Hörner, M.; Cischinsky, H.; Bischof, J. et al. (IWU, IÖR, BUW) (2022): ENOB:dataNWG – Forschungsdatenbank Nichtwohngebäude. Schlussbericht (research database on non-residential buildings, final report, in German). https://www.iwu.de/fileadmin/publikationen/gebaeudebestand/2022_IWU_Hoerner-EtAl_ENOBdataNWG-Schlussbericht-Primaerdatenerhebung-Nichtwohngebaeude-Deutschland.pdf
- Hörner, M. (IWU) (2021): dataNWG – Daten und Fakten zu Nichtwohngebäuden (presentation slides, in German). https://www.iwu.de/fileadmin/publikationen/vortrag/2021-06-28_DFNS_Hoerner_Slides_dataNWG-Daten-und-Fakten.pdf
- de Wilde, P. (2014): The gap between predicted and measured energy performance of buildings: A framework for investigation. Automation in Construction 41, 40–49. https://doi.org/10.1016/j.autcon.2014.02.009
- de Wilde, P.; Jones, R. V. (2014): The building energy performance gap: Up close and personal. CIBSE ASHRAE Technical Symposium. https://pearl.plymouth.ac.uk/cgi/viewcontent.cgi?article=1425&context=ada-research
- Hörner, M.; Jedek, C.; Bagherian, B.; Grafe, M. et al. (IWU, KIT) (2017): Teilenergiekennwerte – Neue Wege in der Energieanalyse von Nichtwohngebäuden im Bestand (new approaches to energy analysis of existing non-residential buildings, in German). https://www.iwu.de/fileadmin/publikationen/energie/tektool/2017_IWU_H%C3%B6rnerEtAl_Teilenergiekennwerte%E2%80%93Neue-Wege-in-der-Energieanalyse-von-Nichtwohngeb%C3%A4uden-im-Bestand.pdf
- University of Cambridge (2012): The prebound effect (on Sunikka-Blank, M.; Galvin, R., Building Research & Information 2012). https://www.cam.ac.uk/research/news/the-prebound-effect
- Federal Office for Economic Affairs and Export Control (BAFA): Bundesförderung für Energieberatung für Nichtwohngebäude, Anlagen und Systeme (federal funding for energy advice for non-residential buildings, plant and systems). https://www.bafa.de/DE/Energie/Energieberatung/Nichtwohngebaeude_Anlagen_Systeme/nichtwohngebaeude_anlagen_systeme_node.html
- co2online: BAFA – Energieberatung für Nichtwohngebäude, Anlagen und Systeme (EBN), Modul 2: Energieberatung DIN V 18599 (programme description, guideline of 23.12.2024, in German). https://www.co2online.de/foerdermittel/details/55576790/
- Haufe: Richtlinie „Energieberatung für Nichtwohngebäude, Anlagen und Systeme“, Gegenstand der Förderung (guideline, scope of funding, in German). https://www.haufe.de/id/norm/richtlinie-energieberatung-fuer-nichtwohngebaeude-anlage-3-gegenstand-der-foerderung-HI16478199_p3.html
- Günther, D.; Wapler, J.; Langner, R.; Helmling, S.; Miara, M. et al. (Fraunhofer ISE) (2020): Wärmepumpen in Bestandsgebäuden. Ergebnisse aus dem Forschungsprojekt „WPsmart im Bestand“. Abschlussbericht (heat pumps in existing buildings, final report, in German). https://wp-monitoring.ise.fraunhofer.de/wpqs-im-bestand/download/Berichte/BMWi-03ET1272A-WPsmart_im_Bestand-Schlussbericht.pdf
- Fraunhofer ISE (2025): Wärmepumpen heizen auch im Altbau klimafreundlich – Forschungsprojekt des Fraunhofer ISE abgeschlossen. Press release of 03.11.2025 (in German). https://www.ise.fraunhofer.de/content/dam/ise/de/documents/presseinformationen/2025/3025_ISE_PI_Waermepumpen-heizen-auch-im-Altbau-klimafreundlich.pdf
- VDI 4646:2026-05: Anwendung von Großwärmepumpen (application of large heat pumps). https://www.dinmedia.de/de/technische-regel/vdi-4646/397776977
- Deurer, J.; Steinbach, J. (IREES) for the German Federal Environment Agency (2025): Der kumulierte Energieaufwand als Förderkriterium im Gebäudebereich (cumulative energy demand as a funding criterion for buildings). TEXTE 71/2025. https://www.umweltbundesamt.de/system/files/medien/11850/publikationen/71_2025_texte.pdf
- Deutsche Gesellschaft für Nachhaltiges Bauen (DGNB) (2021): Benchmarks für die Treibhausgasemissionen der Gebäudekonstruktion (benchmarks for greenhouse gas emissions of building construction; report on the study, in German). https://www.baulinks.de/webplugin/2021/1700.php4
- Efficiency Valuation Organization (EVO): International Performance Measurement and Verification Protocol (IPMVP), 2022 edition. https://evo-world.org/en/products-services-mainmenu-en/protocols/ipmvp
- ISO 50015:2014: Energy management systems – Measurement and verification of energy performance of organizations – General principles and guidance. https://www.iso.org/standard/60043.html
- Umweltbundesamt, Committee on Indoor Air Guide Values (2008, page status 2022): Hygienische Leitwerte für Kohlendioxid in der Innenraumluft (hygienic guide values for carbon dioxide in indoor air, in German). https://www.umweltbundesamt.de/system/files/medien/4031/bilder/dateien/hygienische_leitwerte_0.pdf
- European Parliament and Council (2024): Directive (EU) 2024/1275 on the energy performance of buildings (recast), Article 9(1). https://eur-lex.europa.eu/eli/dir/2024/1275/oj
- European Climate, Infrastructure and Environment Executive Agency (CINEA) (2021): The Carbon Risk Real Estate Monitor (CRREM): a new tool to reduce stranded investments and guide energy-efficiency decisions in real estate. https://cinea.ec.europa.eu/news-events/news/carbon-risk-real-estate-monitor-crrem-new-tool-reduce-stranded-investments-and-guide-energy-2021-07-20_en
- ASHRAE (2016): Proposed ASHRAE/ACCA Standard for Energy Audits Open for Public Comment. https://ashrae.org/about/news/2016/proposed-ashrae-acca-standard-for-energy-audits-open-for-public-comment
- ASHRAE: Standard 211 – Standard for Commercial Building Energy Audits (fact sheet). https://www.ashrae.org/file%20library/about/government%20affairs/advocacy%20toolkit/virtual%20packet/211-2018-factsheet_oct2019.pdf