This article compares guidance from the UK, the US, the WHO and European standards. For offices in Germany it also explains the German workplace rules (Workplace Ordinance (Arbeitsstättenverordnung, ArbStättV) and the Technical Rule for Workplaces ASR A3.6 “Ventilation” (Technische Regel für Arbeitsstätten)); other countries set their own workplace rules. General information, not legal advice (status: October 2026).
Key points
- Indoor air quality in offices depends above all on how much outdoor air reaches each person. CO₂ is the usual indicator: German guidance rates below 1,000 ppm as no concern and above 2,000 ppm as unacceptable [2][5]; the UK HSE treats readings consistently above 1,500 ppm as poor ventilation [24].
- CO₂ shows ventilation, not overall air quality; ASHRAE’s standard 62.1 contains no CO₂ limit [25].
- Studies show that more outdoor air and fewer pollution sources can improve performance and wellbeing [16][20][21]. Whether CO₂ itself or the other substances in exhaled air are responsible is not settled [18][19].
- Temperature, humidity, fine particles (PM2.5) and volatile organic compounds (VOCs) complete the picture. Each has its own reference values and typical sources.
- Spot checks mislead. Measuring over days or weeks under normal use, then adapting ventilation, tells you far more.
Indoor air quality in offices: why it matters
Walk into a full meeting room late in the morning and you notice at once that the air is stale; the people who have sat there for an hour usually do not. That is the core problem of poor office air: it builds up gradually, occupants barely perceive it, and it still affects concentration and wellbeing.
The share of time spent indoors is high. The German Environment Agency (Umweltbundesamt, UBA) states that people spend 80 to 90% of their time indoors on average [1]. For office workers, much of that is working time in shared rooms. Typical situations are covered on the page on indoor air quality in offices.
Poor air quality in the office: symptoms and sick building syndrome
The Institute for Occupational Safety and Health of the German Social Accident Insurance (IFA) lists possible effects of poor indoor air at work: headaches, tiredness, dizziness and poor concentration, more absences, lower working speed and accuracy, and declining attention [12]. The German ASR A3.6 notes that “experience shows that an increased CO₂ concentration has a negative effect on attention” [5].
A cluster of such complaints is often called sick building syndrome. The NHS lists headaches, tiredness and difficulty concentrating among possible symptoms, which get better after leaving the building; the exact cause is unclear, with poor ventilation, dust or fumes and lighting among the likely factors [26]. Such symptoms have many possible causes and are a reason to check the building and seek medical advice, not a diagnosis.
How costly poor ventilation can be is shown by an older but often cited US study. Milton, Glencross and Walters (2000) analysed short-term sick leave of 3,720 employees of one manufacturer in 40 buildings. For office workers in areas with lower outdoor air supply (around 25 cfm, about 12 litres per second per person), the relative risk of short-term sick leave was 1.53 (95% confidence interval 1.22 to 1.92) compared with areas with higher supply (around 50 cfm, about 24 l/s per person). The authors estimated the attributable cost at USD 480 per employee per year [22]. It is an observational study from a single company: it shows an association, not proof of cause and effect.
What office air is made of: CO₂, temperature, humidity, particles and VOCs
Five parameters matter most in an office.
CO₂: not a pollutant at office levels, but a good ventilation indicator
Outdoor air currently contains around 426 ppm CO₂ as a global monthly mean (July 2026, preliminary value from the US agency NOAA) [23]. Every person in a room exhales additional CO₂, together with moisture and odorous substances known as bioeffluents. If too little outdoor air comes in, all of these rise together.
That is why CO₂ serves as a measure of ventilation. The German ASR A3.6 states that where people are the main source of indoor pollutants, “the CO₂ concentration is a recognised measure for assessing air quality” [5], and the German guide “Climate in the office” (DGUV Information 215-520) calls CO₂ an “indicator of stale air” [10]. The HSE adds a useful rule of thumb: 1,000 ppm is equivalent to about 10 litres of outdoor air per second per person [24]. But CO₂ says nothing about substances that do not come from people, such as furniture emissions or outdoor particles; ASHRAE stresses that indoor CO₂ concentrations “do not provide an overall indication of IAQ” [25].
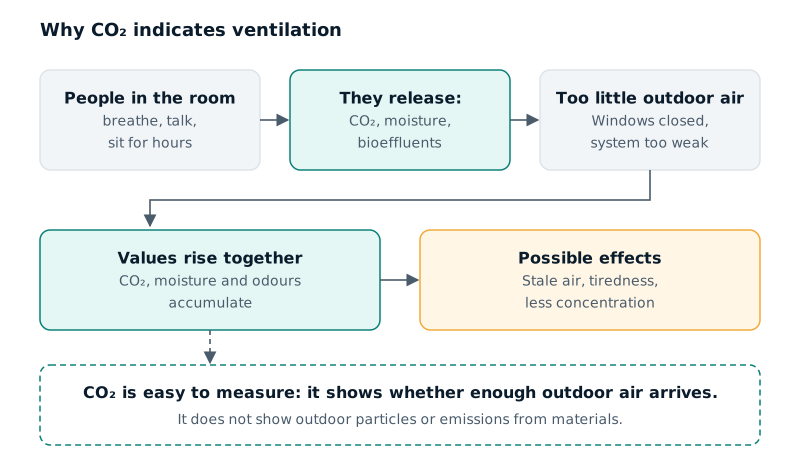 Figure 1: Why CO₂ indicates ventilation. Own illustration based on ASR A3.6 and DGUV Information 215-520. Sources: [5][10].
Temperature and thermal comfort in the workplace
Temperature often shapes comfort most, and the rules differ by country:
- UK: The HSE says indoor workplace temperatures should normally be at least 16 °C, or 13 °C where work involves rigorous physical effort. There is no legal maximum; employers must keep temperatures at a comfortable level and provide clean and fresh air [27].
- Germany: DGUV Information 215-520 gives a minimum air temperature of 20 °C for offices, with 22 to 24 °C regarded as comfortable. Under the workplace rule ASR A3.5 “Room temperature”, air temperature should not exceed 26 °C. Above that, additional measures are foreseen; from 30 °C effective measures must be taken, and above 35 °C a room is generally not suitable as a workroom [8].
Thermal comfort in the workplace most often fails in summer, so log temperature alongside CO₂.
Ideal humidity level in an office
Humidity is less clear-cut than many assume. ASR A3.6 sets only upper limits, depending on temperature: at most 80% relative humidity at 20 °C, 70% at 22 °C, 62% at 24 °C and 55% at 26 °C [5]. According to ASR A3.6, indoor air does not normally need to be humidified. The DGUV states that there is “no lower guide value for relative humidity in workplaces” and that “dry air alone does not generally lead to health problems” [9]. Ventilation systems with humidification are often designed for about 30%, a design value the DGUV cites with reference to EN 16798-1 [9][15]. Complaints about dry air can have very different causes and belong in the risk assessment [9]. Persistently high humidity encourages mould, so the ideal humidity level in an office is therefore best kept within these upper limits.
Fine particles (PM2.5) indoors
Indoor particles come in with outdoor air or are generated in the room. The UBA names smoking, candles, vacuuming without a fine filter, office equipment, cooking and frying, and open fireplaces among the sources [13]. The smaller the particles, the deeper they penetrate the airways. According to the UBA, the World Health Organization has found no concentration below which no harmful effects are expected; Germany has no indoor guide value for particles, and exposure should be kept as low as possible [13].
The WHO’s 2021 global air quality guidelines apply to both outdoor and indoor environments [28]. They set an annual mean guideline level for PM2.5 of 5 µg/m³ and a short-term 24-hour level of 15 µg/m³ (as the 99th percentile, i.e. 3 to 4 exceedance days a year) [29]. These are health-based guidelines, not workplace limits.
For laser printers and copiers, the DGUV gives cautious reassurance: modern devices release hardly measurable amounts of hazardous substances such as ozone, and their dust emissions consist mainly of paper dust [10].
VOCs: emissions from materials and use
Volatile organic compounds come from floor coverings, furniture, paints, adhesives, cleaning agents and fragrances. For the sum of these substances (TVOC), the UBA published a five-level assessment scheme in 2007 [3]:
| Level | TVOC in mg/m³ | UBA assessment |
|---|---|---|
| 1 | up to 0.3 | hygienically no concern |
| 2 | above 0.3 to 1 | hygienically still no concern, provided no guide values for individual substances are exceeded |
| 3 | above 1 to 3 | hygienically noticeable |
| 4 | above 3 to 10 | hygienically of concern |
| 5 | above 10 | hygienically unacceptable |
Table 1: TVOC levels according to the German Environment Agency (2007) [3].
This scheme requires a laboratory analysis. Simple sensors in indoor air monitors usually report VOCs as a sum signal or index. They show changes well, for example after cleaning or after new furniture arrives, but they cannot replace a classification by the UBA levels. Laboratory-standard VOC measurement makes sense when there is a specific reason, such as an odour after a refurbishment. The DGUV stresses that exposure to substances in offices is “generally very low” and that measuring is not always the right way to clarify a problem [10].
Parameters at a glance
| Parameter | What it shows | Reference values | Source |
|---|---|---|---|
| CO₂ | Whether enough outdoor air reaches each person | Germany: below 1,000 ppm no concern, 1,000–2,000 ppm elevated, above 2,000 ppm unacceptable; UK: consistently above 1,500 ppm = poor ventilation | AIR/UBA [2], ASR A3.6 [5], HSE [24] |
| Air temperature | Thermal comfort, overheating | UK: normally at least 16 °C; Germany: offices at least 20 °C, ideally not above 26 °C | HSE [27], DGUV 215-520 with ASR A3.5 [8] |
| Relative humidity | Moisture loads, comfort | Upper limits depending on temperature (e.g. 55% at 26 °C); no lower guide value | ASR A3.6 [5], DGUV [9] |
| Fine particles (PM2.5) | Particles from outside and indoor sources | WHO guideline 5 µg/m³ annual mean, 15 µg/m³ 24-hour; as low as possible | WHO [28][29], UBA [13] |
| VOCs (TVOC) | Emissions from materials, cleaning, use | Up to 0.3 mg/m³ no concern (laboratory analysis) | UBA [3] |
Table 2: Indoor air parameters, what they show and reference values.
What CO2 level is OK in an office? Guidance compared
General information, not legal advice (status: October 2026).
There is no single international CO₂ limit for offices, and the guidance differs in content and status:
- UK (HSE): CO₂ levels consistently higher than 1,500 ppm in an occupied room indicate poor ventilation, and action should be taken. The HSE adds that CO₂ measurements are “only a broad guide to ventilation rather than demonstrating ‘safe levels’” [24].
- US (ASHRAE): ASHRAE Standards 62.1 and 62.2 “do not include CO₂ limits”; claims that 62.1 requires indoor CO₂ below a threshold, typically 1,000 ppm, are “incorrect”, according to ASHRAE [25]. The standard works with ventilation rates instead.
- Europe (EN 16798-1): The European standard provides input parameters for designing and assessing buildings in terms of indoor air quality, temperature, lighting and acoustics [15]; national rules decide how it is applied.
- Germany: There is no statutory CO₂ limit in the sense of a fixed maximum for offices. The Workplace Ordinance requires in its annex, item 3.6, “sufficient breathable air that is beneficial to health” in workrooms [4]. ASR A3.6 “Ventilation” (January 2012 edition, last amended 2018) sets out what this means [7]:
| CO₂ in ppm | Rating (AIR/UBA) | Measures under ASR A3.6 |
|---|---|---|
| below 1,000 | hygienically no concern | No further measures, provided the use of the room is not expected to push levels above 1,000 ppm |
| 1,000 to 2,000 | hygienically elevated | Check and improve ventilation behaviour, draw up a ventilation plan, increase outdoor air supply; document measures in the risk assessment |
| above 2,000 | hygienically unacceptable | Further measures required, e.g. more ventilation or fewer people in the room |
Table 3: CO₂ assessment in Germany according to the German Committee on Indoor Air Guide Values and ASR A3.6, Table 1 [2][5].
The German committee’s rating dates from 2008 and applies to indoor spaces in general [2]. ASR A3.6 adopts the same thresholds for workplaces and links them to measures [5]. Under the ASR, measurements are “as a rule” not required, only where there is a justified suspicion of excessive concentrations [5]. Tracking CO2 levels in the office continuously, for example with a CO₂ traffic light, makes the 1,000 ppm mark visible as a trigger.
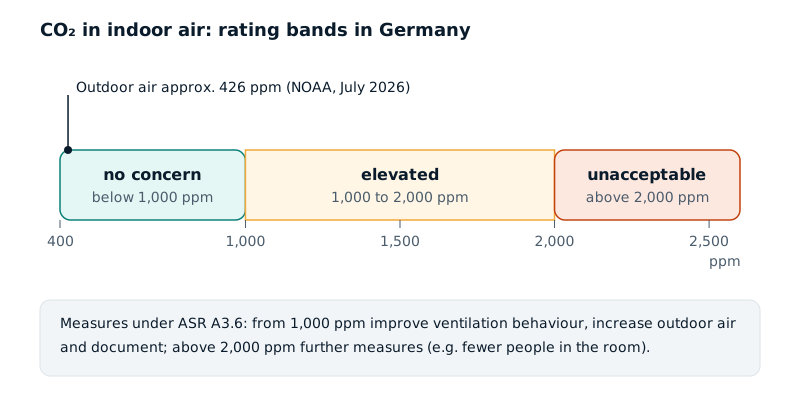 Figure 2: CO₂ rating bands in Germany; outdoor air as the NOAA global monthly mean for July 2026. Sources: [2][5][23].
CO₂, ventilation and performance: what the studies show
That ventilation affects work performance is well documented. How strongly, and through which mechanism, is disputed. A balanced look at the key studies:
Ventilation and pollution sources. In 1999, Wargocki and colleagues placed a 20-year-old carpet behind a partition in a real office as a hidden pollution source. Thirty women worked for 265 minutes each with and without the source. With the source present they typed 6.5% less text, reported headaches more often, and the share dissatisfied with the air rose from 15 to 22% [20]. In 2006, Seppänen, Fisk and Lei pooled numerous laboratory and field studies. They typically found 1 to 3% better performance per 10 l/s more outdoor air per person. The effect was largest below 20 l/s per person and statistically significant up to about 15 l/s per person; above 45 l/s per person it was barely measurable [21].
CO₂ and decision-making. In 2012, Satish and colleagues exposed 22 participants, mostly students, to 600, 1,000 and 2,500 ppm CO₂ for 2.5 hours each in an office-like chamber. Ventilation and temperature stayed the same; only pure CO₂ was added. At 1,000 ppm, six of nine scales of a decision-making test fell significantly; at 2,500 ppm, seven. The authors themselves called some effects so large as to be “almost unbelievable” and called for replication [17]. Allen and colleagues (2016) studied 24 office workers on six days under different conditions. On days with low VOC levels and doubled outdoor air, test scores were on average 101% higher than under “conventional” conditions. For every 400 ppm more CO₂, scores fell by around 21% in the statistical model. Limitations: small sample, laboratory office, funded by a grant from the industrial group United Technologies [16].
Contradictory results. In 2017, Zhang, Wargocki, Lian and Thyregod exposed 25 people to different conditions for 255 minutes each. When pure CO₂ was added to reach 1,000 or 3,000 ppm, there were no significant effects on perceived air quality, symptoms or performance. When CO₂ reached 3,000 ppm because ventilation was reduced and the other human emissions accumulated, headaches, fatigue and sleepiness increased and performance fell [18]. Snow and colleagues (2019) found no direct drop in performance at around 2,700 ppm of pure CO₂, but the usual practice effect failed to appear [19].
What follows. For practice, the dispute matters less than it sounds. In a normally used office, CO₂ almost never rises alone, but together with moisture and bioeffluents. A high CO₂ reading therefore reliably shows that too little outdoor air is arriving, and more outdoor air is the lever the ventilation studies jointly support. What is uncertain is how large the effect is in a particular office. The percentages cannot be transferred directly to a company.
| Study | Participants, duration | What was varied | Result | Limitation |
|---|---|---|---|---|
| Wargocki et al. 1999 [20] | 30, 265 min each | Pollution source on/off | 6.5% less text with source | One office, women only |
| Seppänen et al. 2006 [21] | Analysis of many studies | Outdoor air rate | 1–3% per 10 l/s per person | Pooled estimate |
| Satish et al. 2012 [17] | 22, 2.5 h each | Pure CO₂ 600–2,500 ppm | Decision-making performance falls | Students, very large effects |
| Allen et al. 2016 [16] | 24, 6 days | CO₂, VOCs, outdoor air | Better scores with more air, fewer VOCs | Laboratory office, small sample |
| Zhang et al. 2017 [18] | 25, 255 min each | Pure CO₂ vs. bioeffluents | Only bioeffluents had an effect | Laboratory conditions |
Table 4: Selected studies on ventilation, CO₂ and performance.
Consequences and common mistakes
Poor air rarely shows up as one clear case. A pattern is more typical: afternoon tiredness, headaches in particular rooms, complaints about “stuffy” air or summer heat. The IFA names these complaints and absences as possible consequences [12], though they can have many other causes.
Five mistakes come up again and again:
- Ventilating by feel. People in the room get used to the air. Several studies suggest that performance can drop before occupants perceive the air as poor (summarised by Snow et al.) [19].
- Measuring once and ticking the box. A reading at 9 a.m. in an empty room says nothing about the 2 p.m. meeting (see Figure 3).
- Looking only at CO₂. CO₂ shows ventilation. Overheating, particles from outside or emissions from new furniture stay invisible [25].
- Leaving windows tilted instead of airing fully. A permanently tilted window is not purge ventilation. For offices, ASR A3.6 describes short, intensive airing with windows fully open at regular intervals [6].
- Humidifying without a reason. According to the DGUV, humidifiers must be operated hygienically; air that is too moist quickly exceeds the ASR upper limits [5][9].
Indoor air quality testing: where to place a CO₂ monitor and how long to measure
A good measurement answers a clear question, such as “Is the meeting room adequately ventilated when full?” Whether you use your own monitors or commission indoor air quality testing, four points matter.
Location. The HSE advises placing CO₂ monitors at head height, away from windows, doors and air supply openings, and more than 50 cm from people, because exhaled breath gives misleadingly high readings; larger spaces usually need more than one sampling point [24]. German ASR A3.6 is similar: for rooms up to 50 m², usually one measuring point at about 1.50 m height and 1 to 2 m from the walls, within the occupied zone but far enough from people [5]. Spots directly by a window, above a radiator, in direct sun or next to the printer are poor choices.
Conditions. Measure under normal use and occupancy, after the room has been aired as usual [5]; holiday weeks or Friday afternoons do not reflect everyday conditions.
Duration. For a single compliance check, ASR A3.6 assesses the instantaneous value [5]; the HSE recommends several measurements across the occupied day [24]. CO₂ rises with every person and drops quickly after airing, so patterns (which rooms, times and seasons) only appear over several days or weeks.
Several parameters. Logging temperature, humidity, particles and VOCs alongside CO₂ separates causes: particles rising whenever windows open point outdoors; rising during printing or cleaning, to a source in the room. Continuous indoor air quality monitoring makes these patterns visible.
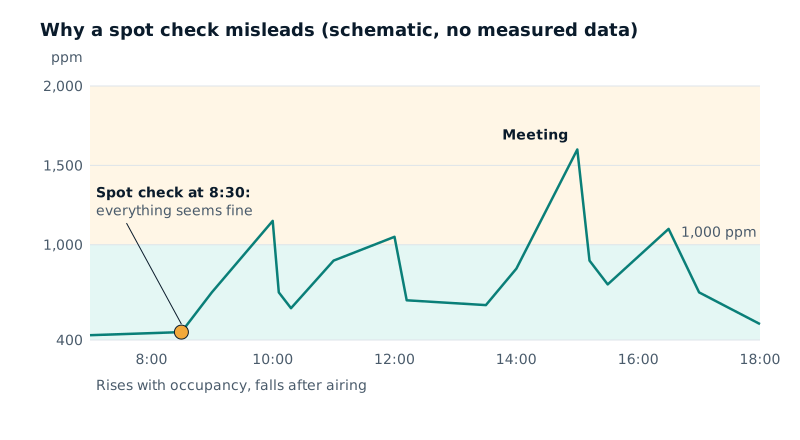 Figure 3: Why spot checks mislead. Schematic illustration without measured data; rating bands as in Germany. Sources: [2][5].
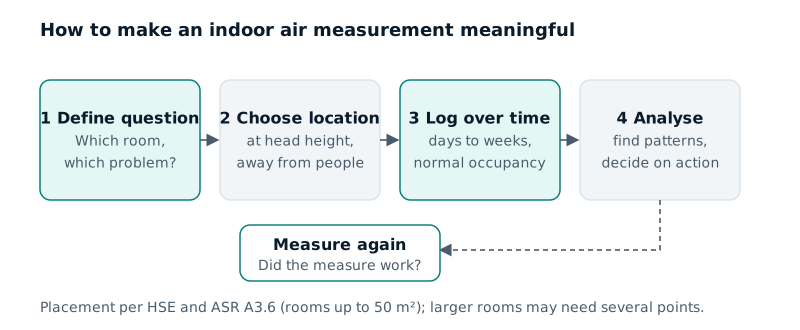 Figure 4: How to make an indoor air measurement meaningful. Own illustration; placement as in HSE guidance and ASR A3.6. Sources: [5][24].
How to improve indoor air quality in an office
Three complementary levers improve office air: reduce sources, ventilate properly and, where necessary, upgrade the ventilation.
Reduce sources
Fewer pollutants in the room mean less ventilation is needed, as the carpet experiment by Wargocki and colleagues showed [20]. In practice: low-emission materials for refurbishment and furnishing, cleaning agents used sparingly and without fragrances, printers in separate rooms, no candles or fragrance diffusers. In case of specific problems, the DGUV recommends finding and removing the source rather than only measuring [10].
Window ventilation by rule
ASR A3.6 gives reference intervals for purge ventilation: after 60 minutes in an office and after 20 minutes in a meeting room. The minimum duration depends on the temperature difference and the wind: up to 10 minutes in summer, 5 minutes in spring and autumn, 3 minutes in winter [6]. Cross-ventilation through opposite windows speeds up the air exchange. A small, full room needs more air than a spacious single office.
Ventilate by CO₂, not by the clock
Fixed intervals do not always match occupancy. Ventilating by CO₂ uses the reading as the trigger: open the windows as the value approaches 1,000 ppm. For older education buildings without mechanical ventilation, the UBA explicitly recommends sensor-based CO₂ traffic lights that show when the concentration reaches a critical range [14]. The principle transfers to offices.
Mechanical and demand-controlled ventilation
Where window ventilation reaches its limits because of noise, security or high occupancy, mechanical ventilation helps. Demand-controlled ventilation adjusts the air volume to readings such as CO₂: a lot of air when the room is full, little when it is empty, so less air is moved and heated than with a system running at full volume. EN 16798-1 provides the design basis for indoor air quality, temperature, lighting and acoustics [15]. Implementation options are described under demand-controlled ventilation by CO₂.
| Strategy | Strengths | Limits | Suitable for |
|---|---|---|---|
| Purge ventilation on a schedule | Simple, no technology | Does not match actual occupancy; heat loss in winter | Single and small offices |
| Ventilating by CO₂ display | Responds to occupancy; makes air visible | People have to act; CO₂ only | Meeting rooms, classrooms |
| Mechanical ventilation, constant volume | Steady air supply regardless of behaviour | Design and maintenance; energy when rooms are empty | Open-plan offices, new buildings |
| Demand-controlled ventilation | Air volume follows demand; saves energy when rooms are empty | Sensors and controls need upkeep | Rooms with changing occupancy |
Table 5: Ventilation strategies compared. Own assessment based on ASR A3.6 and UBA. Sources: [6][14].
Schools and classrooms
The same CO₂ bands apply in schools, but the UBA assesses them differently: 1,000 ppm as the average over a lesson, with short peaks of, for example, 1,500 ppm regarded as acceptable [14]. The IFA points to the same distinction: instantaneous value in offices, average in education [12]. The UBA also states that window ventilation alone is not enough to ensure good air during lessons under current conditions [14]. More on CO2 monitoring in classrooms is on the education page.
How Nebatic helps
Nebatic measures indoor air continuously, room by room. The Nebatic Core device records CO₂, particles, VOCs, temperature, humidity, light and sound; Nebatic AirSense records CO₂, particles, VOCs, temperature and humidity. Both connect via Wi-Fi. The platform shows live values and trends per room, anomalies with notes on the readings, and reports. Existing sensors, meters and building systems can be connected. See the Nebatic devices; holistic building monitoring shows how indoor air can be viewed together with energy and operations.
To find out where your office stands first, Nebatic can measure over an agreed period and analyse the data with recommendations, also as a before-and-after measurement, for example before and after a change to ventilation. Demand-based control approaches are developed together with existing systems and specialist contractors. Nebatic does not make diagnoses and does not replace laboratory analysis of individual substances.
Limits and risks
- No diagnosis. Headaches, tiredness or irritated mucous membranes can have many causes. Anyone with symptoms should see a doctor; at work, the occupational physician and the safety specialist are the right contacts. The DGUV recommends involving both from the start and recording complaints systematically, for example with questionnaires [11].
- Sensors are not a laboratory analysis. A VOC sum signal shows changes but does not name individual substances. Where there is a specific suspicion, such as an odour after refurbishment, the investigation belongs with an accredited laboratory or expert.
- CO₂ only shows ventilation. A low CO₂ value does not mean the air is free of particles or pollutants [25].
- Study results do not transfer. Percentages from laboratory studies say nothing reliable about a particular office [16][17][18].
- Technology needs specialists. Changes to ventilation systems belong with designers and contractors, damp and mould with surveyors. Indoor air monitoring does not replace safety functions such as fire alarm or gas detection systems.
- Legal questions. Whether workplace duties are met is clarified through the risk assessment, safety specialists and, where needed, legal advice.
Frequently asked questions
What CO2 level is acceptable in an office?
German guidance rates below 1,000 ppm as no concern, 1,000–2,000 ppm as elevated and above 2,000 ppm as unacceptable; ASR A3.6 links these bands to ventilation measures [2][5]. The UK HSE treats readings consistently above 1,500 ppm in an occupied room as poor ventilation [24], and ASHRAE 62.1 sets no CO₂ limit [25]. Outdoor air is around 426 ppm [23].
What are the symptoms of poor air quality in an office?
Typical complaints are headaches, tiredness, poor concentration and stuffy air, often worse in the afternoon or in particular rooms [12][26]. In one laboratory study, fatigue and sleepiness increased when human emissions accumulated under low ventilation [18]. These symptoms have many possible causes; persistent complaints call for medical advice.
Where should a CO2 sensor be placed in an office?
At head height in the occupied zone, more than 50 cm from people and away from windows, doors and air supply openings [24]; German ASR A3.6 suggests about 1.50 m height and 1 to 2 m from the walls [5]. Large rooms may need several sensors.
What is the ideal humidity level in an office?
There is no lower guide value for workplaces in Germany [9]. ASR A3.6 sets upper limits that depend on temperature, for example 70% at 22 °C and 55% at 26 °C [5]. Humidification systems are often designed for about 30% [9].
Where do fine particles (PM2.5) in offices come from?
Partly from outdoors, partly from indoor sources such as smoking, candles, vacuuming without a fine filter, office equipment and cooking [13]. The WHO guideline level for PM2.5 is 5 µg/m³ as an annual mean [29]; exposure should be as low as possible.
Is VOC testing in an office worth it?
Sensors show how VOC levels change over time. Classification by the UBA’s TVOC levels requires a laboratory analysis [3]. That is worthwhile when there is a specific reason, such as an odour after refurbishment or complaints.
How often should an office be aired?
ASR A3.6 suggests purge ventilation after 60 minutes in offices and after 20 minutes in meeting rooms, for at least 3 minutes in winter, 5 in spring and autumn and up to 10 in summer [6]. Ventilating by CO₂ reading is more precise.
Sources
- Umweltbundesamt (2024): Indoor air 2024 – measuring, assessing and healthy living (Innenraumluft 2024 – Messen, Bewerten und Gesundes Wohnen). https://www.umweltbundesamt.de/innenraumluft-2024
- Umweltbundesamt / German Committee on Indoor Air Guide Values (status 4 July 2022; CO₂ assessment from 2008): Hygienic guide values for indoor air (Hygienische Leitwerte für die Innenraumluft). https://www.umweltbundesamt.de/system/files/medien/4031/bilder/dateien/hygienische_leitwerte_0.pdf
- Umweltbundesamt (2007): Hygienic guide values for TVOC in indoor air (TVOC levels). https://umweltbundesamt.de/sites/default/files/medien/4031/bilder/dateien/tvoc_level_20210728_en.pdf
- Workplace Ordinance (Verordnung über Arbeitsstätten, ArbStättV), Annex, items 3.5 and 3.6. https://www.gesetze-im-internet.de/arbst_ttv_2004/anhang.html
- Committee for Workplaces / BAuA (2012, amended 2018): ASR A3.6 Ventilation, Section 4 Air quality (incl. Tables 1 and 2), text version BGN Branchenwissen. https://vorschriften.bgn-branchenwissen.de/daten/tr/asr_a3_6/4.htm
- Committee for Workplaces / BAuA (2012, amended 2018): ASR A3.6 Ventilation, Section 5 Natural ventilation (purge ventilation), text version BGN Branchenwissen. https://vorschriften.bgn-branchenwissen.de/daten/tr/asr_a3_6/5.htm
- Federal Institute for Occupational Safety and Health (BAuA): Technical Rules for Workplaces (ASR) – overview and editions. https://www.baua.de/DE/Angebote/Regelwerk/ASR/ASR.html
- DGUV (December 2025 edition): DGUV Information 215-520 Climate in the office, Chapter 1 Questions on air temperature (with quotations from ASR A3.5). https://vorschriften.bgn-branchenwissen.de/daten/dguv/215_520/1.htm
- DGUV (December 2025 edition): DGUV Information 215-520 Climate in the office, Chapter 2 Questions on humidity. https://vorschriften.bgn-branchenwissen.de/daten/dguv/215_520/2.htm
- DGUV (December 2025 edition): DGUV Information 215-520 Climate in the office, Chapter 5 Questions on air quality. https://vorschriften.bgn-branchenwissen.de/daten/dguv/215_520/5.htm
- DGUV (December 2025 edition): DGUV Information 215-520 Climate in the office, Chapter 8 Procedure for complaints. https://vorschriften.bgn-branchenwissen.de/daten/dguv/215_520/8.htm
- Institute for Occupational Safety and Health of the DGUV (IFA): Indoor air quality (Raumluftqualität in Innenräumen). https://www.dguv.de/ifa/praxishilfen/innenraumarbeitsplaetze/raumluftqualitaet/
- Umweltbundesamt (2017): Fine particles in indoor spaces (Feinstaub in Innenräumen). https://umweltbundesamt.de/themen/gesundheit/umwelteinfluesse-auf-den-menschen/innenraumluft/feinstaub-in-innenraeumen
- Umweltbundesamt, Ventilation Working Group (2019): Requirements for ventilation concepts in education buildings – current recommendations (presentation A. Daniels, BfR training for the public health service). https://www.BFR.bund.de/cm/343/anforderungen-an-lueftungskonzeptionen-in-bildungsgebaeuden-aktuelle-empfehlungen.pdf
- DIN EN 16798-1:2022-03: Energy performance of buildings – Ventilation for buildings – Part 1: Indoor environmental input parameters for design and assessment of energy performance of buildings addressing indoor air quality, thermal environment, lighting and acoustics – Module M1-6. https://www.dinmedia.de/de/norm/din-en-16798-1/349622591
- Allen, J. G.; MacNaughton, P.; Satish, U.; Santanam, S.; Vallarino, J.; Spengler, J. D. (2016): Associations of Cognitive Function Scores with Carbon Dioxide, Ventilation, and Volatile Organic Compound Exposures in Office Workers. Environmental Health Perspectives 124, 805–812. https://ehp.niehs.nih.gov/doi/10.1289/ehp.1510037
- Satish, U.; Mendell, M. J.; Shekhar, K.; Hotchi, T.; Sullivan, D.; Streufert, S.; Fisk, W. J. (2012): Is CO2 an Indoor Pollutant? Direct Effects of Low-to-Moderate CO2 Concentrations on Human Decision-Making Performance. Environmental Health Perspectives 120(12), 1671–1677. https://pmc.ncbi.nlm.nih.gov/articles/PMC3548274
- Zhang, X.; Wargocki, P.; Lian, Z.; Thyregod, C. (2017): Effects of exposure to carbon dioxide and bioeffluents on perceived air quality, self-assessed acute health symptoms, and cognitive performance. Indoor Air 27(1), 47–64. https://orbit.dtu.dk/en/publications/effects-of-exposure-to-carbon-dioxide-and-bioeffluents-on-perceiv/
- Snow, S.; Boysen, A. S.; Paas, K. H. W.; Gough, H.; King, M.-F.; Barlow, J.; Noakes, C. J.; schraefel, m. c. (2019): Exploring the physiological, neurophysiological and cognitive performance effects of elevated carbon dioxide concentrations indoors. Building and Environment 156, 243–252. https://eprints.soton.ac.uk/430405/1/30_april_1_s2.0_S0360132319302422_main.pdf
- Wargocki, P.; Wyon, D. P.; Baik, Y. K.; Clausen, G.; Fanger, P. O. (1999): Perceived air quality, sick building syndrome (SBS) symptoms and productivity in an office with two different pollution loads. Indoor Air 9, 165–179. https://www.aivc.org/node/26791
- Seppänen, O.; Fisk, W. J.; Lei-Gomez, Q. (2006): Ventilation and performance in office work. Indoor Air 16. https://indoor.lbl.gov/publications/ventilation-and-work-performance
- Milton, D. K.; Glencross, P. M.; Walters, M. D. (2000): Risk of sick leave associated with outdoor air supply rate, humidification, and occupant complaints. Indoor Air 10(4), 212–221. https://stacks.cdc.gov/view/cdc/190757
- NOAA Global Monitoring Laboratory: Trends in Atmospheric Carbon Dioxide – Global Monthly Mean (accessed October 2026). https://gml.noaa.gov/ccgg/trends/global.html
- Health and Safety Executive (HSE): Using CO2 monitors – Ventilation in the workplace (accessed October 2026). https://www.hse.gov.uk/ventilation/using-co2-monitors.htm
- ASHRAE (2023): Indoor Carbon Dioxide, Ventilation and Indoor Air Quality (Government Affairs brief, updated 30 June 2023). https://www.ashrae.org/file%20library/about/government%20affairs/public%20policy%20resources/briefs/indoor-carbon-dioxide-ventilation-and-indoor-air-quality_2023.pdf
- NHS (2023): Sick building syndrome (page last reviewed 24 July 2023). https://www.nhs.uk/conditions/Sick-building-syndrome/
- Health and Safety Executive (HSE): Temperature in the workplace – Is it too hot or cold to work? (accessed October 2026). https://www.hse.gov.uk/temperature/employer/index.htm
- World Health Organization (2021): New WHO Global Air Quality Guidelines aim to save millions of lives from air pollution (news release, 22 September 2021). https://www.who.int/news/item/22-09-2021-new-who-global-air-quality-guidelines-aim-to-save-millions-of-lives-from-air-pollution
- Committee on the Medical Effects of Air Pollutants (COMEAP), UK government (2022): COMEAP statement: response to publication of the World Health Organization air quality guidelines 2021. https://www.gov.uk/government/publications/comeap-statement-response-to-who-air-quality-guidelines-2021/comeap-statement-response-to-publication-of-the-world-health-organization-air-quality-guidelines-2021