Key points
- Predictive maintenance for HVAC means servicing plant according to its actual condition and visible trends, not only after an alarm or at fixed intervals. The terms are defined in EN 13306 and by the IEC [1][2][3][4].
- Most failures give warning: clogged filters, slipping belts, drifting sensors, stuck valves and a short-cycling heat pump all leave traces in room temperatures, flow and return temperatures, run times, pressures and CO₂ readings.
- Faults are common. In an analysis of more than 60,000 HVAC components in US commercial buildings, about 40% of air handling units had at least one reported fault on any given day [13]. Organisations using fault detection and diagnostics (FDD) software reported median energy savings of 8% [12].
- An alarm comes from the plant’s own controller, usually once a limit is already breached. Monitoring aims to show deviations earlier; it does not replace safety alarms or manufacturer maintenance.
- False alarms, poor data quality and unclear responsibilities can cancel out the benefit. What matters most is who acts on a warning.
Predictive maintenance for HVAC: why plant failures are so costly
A heating failure on a Monday morning in January, hotel air conditioning that cuts out on a hot weekend, a supermarket display case that slowly warms up overnight: for facility managers these are everyday events. They look sudden, but usually have a history of days or weeks in which the plant was already behaving differently. Predictive maintenance for HVAC (in UK usage, predictive maintenance for building services) is about reading that history in time.
A study from Lawrence Berkeley National Laboratory (LBNL) shows how common such histories are. Crowe and colleagues analysed several years of data from automated fault detection software covering more than 60,000 heating, ventilation and air conditioning (HVAC) components in US commercial buildings. They found more than 90 fault types. Twenty-one of them occurred in at least 20% of air handling units (AHUs), and 18 AHU faults were present for more than 20% of the period studied. On any given day, around 40% of AHUs and 30% of zone terminal units had at least one reported fault [13]. The data come from US buildings that already used FDD software and cannot be transferred one to one to Europe. But they show that faults are a permanent, often unnoticed state rather than an exception.
The US Department of Energy (DOE) estimates the energy lost through such faults in US commercial buildings at about 0.7 quads per year, worth almost USD 14 billion, and itself notes that the estimate could be improved with better data on fault prevalence [14].
Failures cost more than energy:
- Complaints and lost comfort: offices that are too cold, overheated hotel rooms, stuffy meeting rooms.
- Rooms taken out of use: when temperature or air quality is unacceptable, or the use (patient rooms, server rooms, storage) needs specific conditions.
- Spoiled stock: a refrigeration failure in a shop can affect whole product ranges. In Germany, for example, the regulation on quick-frozen foods (Verordnung über tiefgefrorene Lebensmittel, TLMV) requires frozen food to be kept constantly at −18 °C or colder; brief upward deviations of no more than 3 °C are allowed only during shipment, local distribution and in retail freezer cabinets [19].
- Hygiene: under the German guideline VDI 6022 Part 1, ventilation and air-conditioning systems must at least not have a negative effect on indoor air; the guideline sets hygiene requirements for design, operation and maintenance [8].
- Emergency call-out costs: out-of-hours visits, rush orders for parts and temporary heaters or cooling units cost more than a planned job. There are no robust, generally valid figures; costs depend on contract, region and plant.
How HVAC faults develop: the early warning signs
Building services plant rarely fails from one moment to the next. A component deteriorates step by step and the controls compensate for a while: a valve opens further, a fan speeds up, a compressor runs longer. Only when that reserve is used up does the plant breach a limit and raise an alarm.
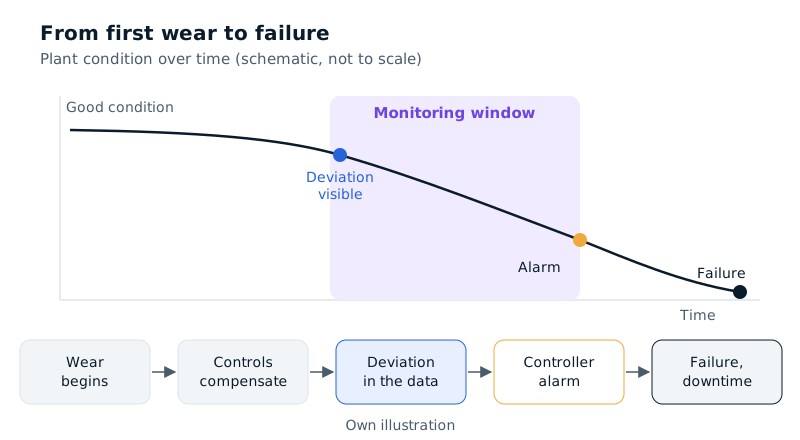 Figure 1: From first wear to failure. Monitoring targets the window between the first visible deviation and the controller alarm. Own illustration.
Alarms vs fault detection: two different things
An alarm is generated by the plant itself. The controller of a boiler, heat pump, air handling unit or refrigeration system watches fixed conditions: high pressure, low pressure, frost protection, motor protection, flame supervision, flow switches. If a condition is breached, the plant shuts down or switches to emergency mode and reports the fault, depending on how it is equipped, on its own display, to the building management system (BMS) or to a service provider. These alarms are important and often safety-related, but usually arrive only when the situation is already critical. Good BMS alarm management keeps them visible and prioritised; it does not make them arrive earlier.
Technical monitoring and fault detection and diagnostics (FDD) instead look at ongoing operation over a longer period and compare it with what would be expected: with the plant’s own behaviour in previous weeks, with similar plant, or with setpoints. The aim is to show deviations before a limit is breached. Monitoring complements alarms; it does not replace them.
Heating systems: typical early signs of a fault
A heating fault is often pictured as a boiler or heat pump that stops completely. Creeping problems in heat distribution are more common:
- Stuck or malfunctioning valves: a circuit is no longer supplied, some rooms stay cold while others overheat.
- Missing or outdated hydraulic balancing: the return temperature stays high and pumps run at a high setting.
- Wrong heating curve or setback times: rooms are still cold in the morning, or the system heats unnecessarily at night.
- Drifting sensors: an outdoor or flow temperature sensor that reads a few kelvin off shifts the whole control strategy without ever triggering an alarm.
Early signs in the data include a shrinking difference between flow and return temperatures, room temperatures that deviate systematically in certain zones, and burner or pump run times that increase in comparable weather.
Heat pumps: short cycling, oversizing and efficiency
For heat pumps, cycling behaviour is a key signal. If the compressor switches on and off very often, efficiency usually falls and mechanical wear rises. Fraunhofer ISE’s heat pump field test measured 77 heat pumps in one- to three-family homes over four years [16]. According to a report on the results, many of the units were oversized relative to consumption, and switching frequencies were very high for some of them. In some systems with combined storage tanks, space heating and hot water temperatures were not reliably separated, so heat was produced unnecessarily at hot water temperature [17].
The measured seasonal performance factors (SPF, the ratio of heat produced to electricity used over a year; German JAZ) show how wide the range is in real operation: air-to-water heat pumps reached an average SPF of 3.4, with a range of 2.6 to 4.9; ground-source heat pumps an average of 4.3, with a range of 3.6 to 5.4 [17]. The differences have many causes (building, heat source, emitters, use), not only set-up or operating faults. But they show that it pays to measure efficiency in operation rather than assume it.
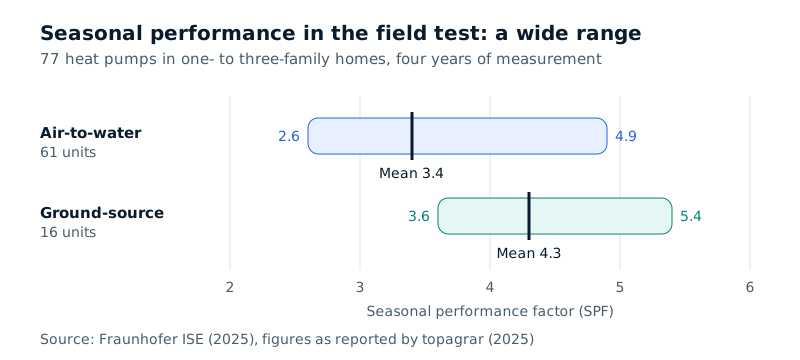 Figure 2: Range and mean of seasonal performance factors for 61 air-to-water and 16 ground-source heat pumps in the Fraunhofer ISE field test. Sources: Fraunhofer ISE (2025), figures as reported by topagrar (2025) [16][17].
Worked example (illustrative): Assume a building needs 20,000 kWh of heat per year for space heating and hot water. With an SPF of 3.4, the heat pump needs around 5,880 kWh of electricity (20,000 ÷ 3.4). With an SPF of 2.6 it would need around 7,690 kWh (20,000 ÷ 2.6), roughly 1,810 kWh more. These figures only illustrate the range from the field test; they say nothing about how much of that difference better settings could recover in a specific building.
For this reason, heat pump monitoring relies above all on heat meters and electricity meters (for the actual performance factor), flow and return temperatures, compressor starts per hour and per day, run times of the backup electric heater and room temperatures.
Air conditioning and refrigeration
In air conditioning and refrigeration, problems often show up in temperature and run time: a cold room takes longer to recover after the door has been opened, the compressor runs longer at the same outdoor temperature, the temperature fluctuates more than usual. Possible causes include an iced or dirty evaporator, a dirty condenser, refrigerant loss or a faulty fan. A refrigeration failure often shows up in the data beforehand as a slow temperature rise overnight or as poor recovery after defrost cycles. This is the core of supermarket refrigeration monitoring. Diagnosing the cause remains the job of a qualified refrigeration technician.
Air handling units: filters, belts, fans and dampers
For AHU fault detection, these are the typical wearing parts and sources of faults:
- Filters that clog: pressure drop rises, so the fan has to work harder or the airflow falls.
- V-belts that stretch or slip: airflow drops even though the motor is running.
- Fans and bearings: rising power draw, noise, vibration.
- Dampers and actuators that stick: too little outdoor air, or an unwanted share of outdoor air in winter.
- Sensors that drift: the unit controls to a wrong value.
A ventilation fault that does not trip the unit is often first noticeable in the room through air quality. CO₂ concentration is used as an indicator of whether enough outdoor air is arriving. The German Committee on Indoor Air Guide Values at the Federal Environment Agency (Umweltbundesamt) rates concentrations below 1,000 ppm as hygienically harmless, 1,000 to 2,000 ppm as hygienically conspicuous and above 2,000 ppm as hygienically unacceptable [20]. CO₂ levels that rise over weeks with the same occupancy can point to falling airflow, for example from a clogged filter or a slipping belt, or simply to a change in use; the data give a hint, not a diagnosis.
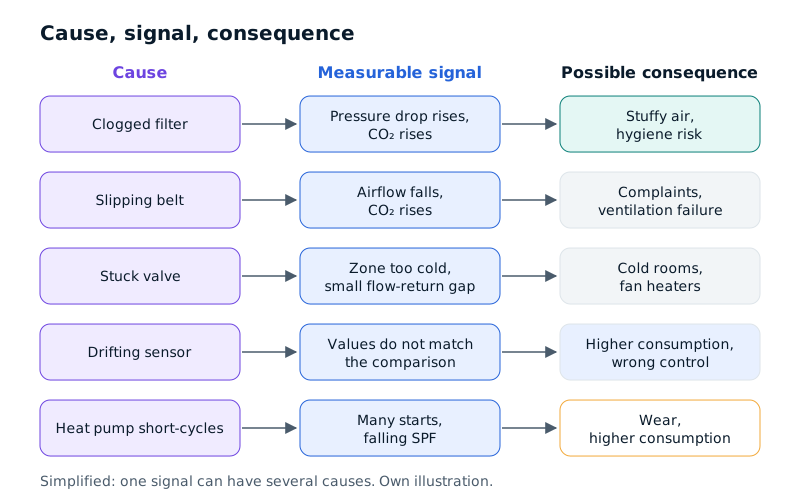 Figure 3: Typical causes, their measurable signals and possible consequences. The mapping is simplified: one signal can have several causes. Own illustration.
Common mistakes in day-to-day operation
The biggest damage rarely comes from a single defect but from a chain of small omissions:
Reacting only to alarms. Working purely reactively means learning about a problem once the plant has shut down, with no room left for a planned repair.
Maintaining by the calendar without looking at operation. Fixed intervals make sense and are often required by law or contract, but they say nothing about what happens between visits. A filter that is already clogged after three months is changed three months too late on a six-monthly schedule; a filter that is still clean after six months is changed too early.
Treating comfort complaints as one-offs. When complaints about cold or hot rooms pile up, there is often a plant problem behind them. Handled one by one (turn up the thermostat, bring in a fan heater), the cause remains and consumption rises.
Collecting data that nobody looks at. Many BMS installations store trend logs that are never analysed. Without a clear owner and routine, they bring no benefit.
Never revisiting settings after commissioning. Heating curves, schedules and setpoints are set at commissioning and rarely adjusted, even though use and occupancy change. German law now addresses this for heat pumps (see below).
Preventive vs predictive maintenance: the strategies compared
Maintenance terminology is standardised in EN 13306 (in Germany published as DIN EN 13306:2018-02) [1]. The German standard DIN 31051 (2019-06) is aligned with these terms and divides maintenance into four basic activities: servicing, inspection, repair and improvement [5]. For strategy, the main question is what triggers an intervention.
The International Electrotechnical Commission (IEC) defines preventive maintenance as maintenance carried out to mitigate degradation and reduce the probability of failure [2]. Condition-based maintenance is preventive maintenance based on the assessment of physical condition; that assessment can be made by observation, on a schedule or by monitoring system parameters [3]. Under EN 13306, predictive maintenance is condition-based maintenance carried out following a forecast derived from repeated analysis or known characteristics and the evaluation of the significant parameters of degradation [4]. In short, the debate about preventive vs predictive maintenance is really about which trigger fits which asset.
| Strategy | Trigger | Typical example | Strengths | Weaknesses |
|---|---|---|---|---|
| Reactive (corrective maintenance) | A fault or failure has occurred | Repair after the boiler raises an alarm | No planning effort, components used to the end of their life | Unplanned downtime, call-out costs, consequential damage |
| Preventive, time-based (predetermined) | Fixed interval or operating hours | Filter change every six months, annual service | Easy to plan and contract, often mandatory | Too early or too late, condition between visits unknown |
| Condition-based | Measured or observed condition reaches a threshold | Filter change when a set pressure drop is reached | Action when it is needed, fewer unnecessary visits | Needs measurement, thresholds and someone to respond |
| Predictive | Forecast from trends and comparisons | Run-time and start trend of a heat pump points to a problem | Planned intervention before failure | Needs data history, models and experience; false alarms possible |
Table 1: Maintenance strategies by trigger. Terms as in EN 13306 [1] and the IEC definitions [2][3][4]; examples and assessment simplified.
In practice the strategies are combined: safety checks and manufacturer servicing stay time-based, wearing parts are replaced on condition, and critical plant gets predictive analysis on top.
Maintenance standards and guidance in Germany
Owners with buildings in Germany will meet these service specifications and guidelines (other countries have their own equivalents):
- VDMA 24186 describes service programmes for the maintenance of technical systems and equipment in buildings, organised by type of plant; Part 1 (2019-09) covers air-handling equipment and systems [6].
- AMEV (the working group for mechanical and electrical engineering in state and municipal administrations) provides model contracts for public buildings, including “Wartung 2018” (status 10/2024) and “Instandhaltung 2014” (status 10/2021), and the recommendation “Technisches Monitoring 2025” as a quality assurance tool [7].
- VDI 6022 Part 1 (2018-01) sets hygiene requirements for ventilation and air-conditioning systems and units across design, manufacture, installation, operation and maintenance [8].
- VDI-MT 3810 Part 1 (2023-03) covers the basics of operating and maintaining buildings and building services, including operator responsibility, operating documentation and contractual arrangements [9].
These documents are paid publications; the content above is based on the publishers’ descriptions.
Heat pump checks under German law
General information, not legal advice (status: October 2026). Under section 60a of the Building Modernisation Act (Gebäudemodernisierungsgesetz, GModG; until July 2026 the Buildings Energy Act, Gebäudeenergiegesetz, GEG), heat pumps used for space heating that were installed after 31 December 2023 in buildings with at least six dwellings or other independent units must undergo an operational check after one full heating season, and no later than two years after commissioning. The check covers, among other things, hydraulic balancing, control parameters such as the heating curve and switch-off times, flow and return temperatures, and the measured seasonal performance factor. For heat pumps that are not subject to remote monitoring, the check must be repeated at least every five years [18]. The act was amended in 2026; check the version in force for your case or seek advice.
What the evidence says: FDD, AFDD and monitoring-based commissioning
The best data on the benefits of monitoring and automated fault detection and diagnostics (AFDD) come from the USA, mainly from LBNL.
Commissioning and retro-commissioning of existing buildings. Evan Mills (2011) analysed data from 643 commercial buildings with 99 million square feet of floor area (about 9.2 million m²) and from 37 commissioning providers. In the third of projects for which data were available, more than 10,000 energy-related deficiencies were found. Median savings in existing buildings were 16% of whole-building energy use, with a payback time of 1.1 years [10]. These figures refer to systematic commissioning and optimisation projects, not to monitoring software alone. But they show how many deficiencies go undetected in day-to-day operation.
Energy information systems and fault detection. In the Smart Energy Analytics Campaign, Kramer and colleagues (2019) analysed data from 35 portfolio owners with more than 400 million square feet. Users who reported savings achieved a median of USD 0.19 per square foot and 7% per year, and savings grew over time. FDD systems delivered both higher savings and higher costs than energy information systems alone [11]. This body of work is often summarised as monitoring-based commissioning (MBCx): using continuous data to keep finding and fixing problems after the initial commissioning. Lin, Kramer and Granderson (2020) report median savings of 8% for 26 organisations using FDD software across 550 buildings [12].
Methods. Kim and Katipamula (2018) review the studies on automated fault detection and diagnostics in building systems published since 2004, group the methods into three categories and compare commercial products and services, as a guide for choosing suitable methods [15].
Limitations: the data come mostly from larger US commercial buildings with existing building automation, some savings are self-reported, and savings only materialise when detected faults are fixed. The studies mainly measure energy, not avoided failures; robust data on how many failures monitoring prevents are scarcer.
HVAC fault detection: which data show early signs
Effective remote monitoring of building systems does not necessarily need many data points, but the right ones. The overview below shows which measurements make typical problems visible early.
| Measurement | Early signs to look for | Possible causes (to be checked by a qualified technician) |
|---|---|---|
| Room temperature per zone | Systematic deviation in some zones, slow warm-up in the morning | Valve, actuator, hydraulic balancing, time schedule |
| Flow and return temperature | Small difference, high return temperature, flow does not match the heating curve | Pump, balancing, heating curve, sensor drift |
| Run times | Longer run time in comparable weather | Fouling, loss of capacity, refrigerant loss |
| Starts per hour (cycling) | Many short cycles | Oversizing, control parameters, too little flow |
| Pressure and differential pressure | Rising pressure drop across filters, falling system pressure | Clogged filter, leak, expansion vessel |
| CO₂ in rooms | Rising values with the same occupancy | Falling outdoor airflow, damper, belt, filter |
| Electricity and heat meters | Falling performance factor, rising consumption | Settings, backup heater, fouling |
| Cold room and display case temperatures | Slow rise overnight, poor recovery after defrost | Evaporator, condenser, fan, refrigerant |
Table 2: Measurements and early signs. A signal is a hint, not a diagnosis.
A single value says little. It becomes meaningful over time (today against previous weeks), in comparison (zone A against zone B, unit 1 against unit 2) and in context (run time relative to outdoor temperature). Condition-based maintenance also needs a clear rule, for each measurement, on when action is taken and by whom.
Getting started in five steps
- Identify critical plant: which failures would have the greatest impact (refrigeration in retail, air conditioning in a hotel, ventilation in meeting or treatment rooms, heat generation in winter)?
- Use the data you already have: the BMS, meters and controllers often provide trends; room sensors fill gaps.
- Describe normal operation: how does the plant behave on a typical day in typical weather?
- Set thresholds and responsibilities: who checks a warning, by when, and when is the service contractor called?
- Close the loop: findings from call-outs feed back into thresholds and maintenance plans.
How Nebatic helps
Nebatic offers technical monitoring for buildings: its own room sensors (Nebatic Core and Nebatic AirSense) record CO₂, temperature and humidity, among other values, over Wi-Fi. The platform shows live values, trends, anomalies, notices and reports. Where agreed in a project, existing meters, sensors and building systems can be connected so that room data and plant data can be viewed together. For heat pumps there is a dedicated page on monitoring heat pumps in operation.
For more advanced requirements, Nebatic develops custom AI analyses together with existing systems and service contractors, for example for predictive maintenance of building services. How this can look for operators and service providers is described on the pages for facility management, hotels and retail.
Nebatic does not make diagnoses and does not replace safety-related alarm systems, plant alarms or maintenance to the manufacturer’s specification. Anomalies and notices on the platform are a basis for checks by operators and qualified contractors.
Limits and risks
False alarms. Any analysis that warns before a failure will sometimes warn for no reason, and too many notices get ignored. Thresholds have to be adapted to the plant and its use and reviewed regularly.
Data quality. Drifting or badly placed sensors, data gaps, wrongly mapped points and timestamps lead to wrong conclusions. Monitoring can reveal a drifting sensor, but it is only as good as the measurement.
No diagnosis. A signal shows that something has changed, but not necessarily why. The cause is established on site by a qualified person: the heating engineer, the refrigeration technician, the ventilation engineer or the manufacturer’s service team.
Safety systems stay. Safety shut-offs, plant alarms, fire and gas detection, pressure and temperature limiters and mandatory inspections remain essential. Monitoring is an extra layer, not a replacement.
Mandatory maintenance stays. Manufacturer requirements, maintenance contracts, hygiene inspections (in Germany under VDI 6022) and statutory inspection duties apply regardless of whether monitoring is in place.
Organisation. The biggest bottleneck is rarely the technology but who responds to a warning, and whether there is time and budget for it. The LBNL studies show savings where detected faults were actually fixed [11][12].
Whom to involve: for boilers and heat pumps, the installer or manufacturer’s service; for refrigeration, a suitably qualified refrigeration technician; for ventilation hygiene, qualified specialists (in Germany under VDI 6022); for inspection duties, legal or energy advice.
Frequently asked questions
What is predictive maintenance in HVAC?
Predictive maintenance uses operating data and their trends to estimate when an intervention is needed before a failure is likely. Under EN 13306 it is a form of condition-based maintenance [1][4]. In HVAC and building services it typically analyses temperatures, run times, starts, pressures and consumption.
What is the difference between condition-based and predictive maintenance?
Condition-based maintenance acts when a measured or observed condition reaches a threshold, for example a filter reaching a set pressure drop [3]. Predictive maintenance goes one step further and forecasts from trends when that threshold is likely to be reached [4].
What is fault detection and diagnostics (FDD) in buildings?
FDD software compares building and plant data with expected behaviour and flags deviations, such as a valve that does not close or a drifting sensor. In an LBNL study, 26 organisations using FDD software across 550 buildings reported median energy savings of 8% [12]. The savings depend on detected faults actually being fixed.
How common are HVAC faults in commercial buildings?
Very common. An LBNL analysis of more than 60,000 HVAC components in US commercial buildings found more than 90 fault types; on any given day, about 40% of air handling units and 30% of zone terminal units had at least one reported fault [13].
How can I spot a heating system fault before it fails?
Watch for rooms that are permanently too cold or too warm, a shrinking flow-return temperature difference, longer run times in comparable weather and, for heat pumps, many short compressor starts. A qualified contractor should check the cause.
What does heat pump monitoring show?
It shows how efficiently the heat pump really works and whether it short-cycles or relies on its backup heater. In the Fraunhofer ISE field test, the seasonal performance factors of air-to-water heat pumps ranged from 2.6 to 4.9 [17]. In Germany, the law requires an operational check for certain heat pumps in larger buildings; without remote monitoring it must be repeated at least every five years [18].
How can supermarket refrigeration failures be detected early?
Warning signs are a slow overnight temperature rise in cold rooms or cabinets, poorer recovery after defrost and longer compressor run times. Frozen food must be kept constantly at −18 °C or colder under German rules [19]. Temperature monitoring does not replace maintenance by a refrigeration technician.
Does monitoring replace maintenance to the manufacturer’s specification?
No. It helps target maintenance and catch problems between visits. Manufacturer servicing, hygiene inspections, safety checks and statutory inspections remain.
Sources
- DIN Deutsches Institut für Normung (2018): DIN EN 13306:2018-02 Maintenance – Maintenance terminology; trilingual version EN 13306:2017. https://www.dinmedia.de/de/norm/din-en-13306/270274780
- International Electrotechnical Commission (IEC): Electropedia, IEV 192-06-05 “preventive maintenance”. https://electropedia.org/iev/iev.nsf/IEVref_xref/en:192-06-05
- International Electrotechnical Commission (IEC): Electropedia, IEV 192-06-07 “condition-based maintenance”. https://electropedia.org/iev/iev.nsf/IEVref_xref/en:192-06-07
- Techniques de l’Ingénieur: Introduction to maintenance methods – Predictive preventive maintenance (definition according to NF EN 13306). https://www.techniques-ingenieur.fr/en/resources/article/ti095/introduction-to-maintenance-methods-mt9280/predictive-preventive-maintenance-5
- DIN Deutsches Institut für Normung (2019): DIN 31051:2019-06 Fundamentals of maintenance. https://www.dinmedia.de/de/norm/din-31051/303020440
- VDMA (2019): VDMA 24186-1:2019-09 Service programme for the maintenance of technical systems and equipment in buildings – Part 1: Air-handling equipment and systems. https://din.de/de/wdc-beuth:din21:311838650
- Ministry for Home Affairs, Local Government, Building and Digitalisation of North Rhine-Westphalia (2026): TGA-Empfehlungen NRW, list of AMEV recommendations (status 20.03.2026). https://www.mhkbd.nrw/system/files/media/document/file/2026_03_20_liste_tga-empfehlungen_nrw.pdf
- VDI (2018): VDI 6022 Part 1:2018-01 Ventilation and indoor-air quality – Hygiene requirements for ventilation and air-conditioning systems and units (VDI Ventilation Code of Practice). https://www.dinmedia.de/de/technische-regel/vdi-6022-blatt-1/279023701
- VDI (2023): VDI-MT 3810 Part 1:2023-03 Operation and maintenance of buildings and building services – Fundamentals. https://www.dinmedia.de/de/technische-regel/vdi-mt-3810-blatt-1/361287511
- Mills, E. (2011): Building commissioning: a golden opportunity for reducing energy costs and greenhouse gas emissions in the United States. Energy Efficiency. Lawrence Berkeley National Laboratory. https://bies.lbl.gov/publications/building-commissioning-golden
- Kramer, H.; Lin, G.; Curtin, C.; Crowe, E.; Granderson, J. (2019): Building analytics and monitoring-based commissioning: industry practice, costs, and savings. Energy Efficiency. https://eta-publications.lbl.gov/publications/building-analytics-and-monitoring
- Lin, G.; Kramer, H.; Granderson, J. (2020): Building fault detection and diagnostics: Achieved savings, and methods to evaluate algorithm performance. Building and Environment 168. https://bies.lbl.gov/publications/building-fault-detection-and
- Crowe, E.; Chen, Y.; Reeve, H.; Yuill, D.; Ebrahimifakhar, A.; Chen, Y.; Troup, L.; Smith, A.; Granderson, J. (2023): Empirical Analysis of the Prevalence of HVAC Faults in Commercial Buildings. Science and Technology for the Built Environment. https://eta-publications.lbl.gov/bibcite/reference/36129
- U.S. Department of Energy, Building Technologies Office (2020): Evaluation of Fault Prevalence in Commercial Buildings. https://www.energy.gov/eere/buildings/articles/evaluation-fault-prevalence-commercial-buildings
- Kim, W.; Katipamula, S. (2018): A Review of Fault Detection and Diagnostics Methods for Building Systems. Science and Technology for the Built Environment 24(1), 3–21. https://www.pnnl.gov/publications/review-fault-detection-and-diagnostics-methods-building-systems
- Fraunhofer ISE (2025): Wärmepumpen heizen auch im Altbau klimafreundlich – Forschungsprojekt des Fraunhofer ISE abgeschlossen (heat pumps also heat older buildings in a climate-friendly way; press release, in German). https://www.ise.fraunhofer.de/de/presse-und-medien/presseinformationen/2025/waermepumpen-heizen-auch-im-altbau-klimafreundlich-forschungsprojekt-des-fraunhofer-ise-abgeschlossen.html
- topagrar (2025): Wärmepumpen heizen auch im Altbau klimafreundlich (report on the results of the Fraunhofer ISE field test, in German). https://www.topagrar.com/energie/news/warmepumpen-heizen-auch-im-altbau-klimafreundlich-20019619.html
- Federal Republic of Germany: Building Modernisation Act (Gebäudemodernisierungsgesetz, GModG, formerly Gebäudeenergiegesetz), section 60a Inspection and optimisation of heat pumps. https://www.gesetze-im-internet.de/geg/__60a.html
- Federal Republic of Germany: Regulation on quick-frozen foods (Verordnung über tiefgefrorene Lebensmittel, TLMV), section 2. https://www.gesetze-im-internet.de/tlmv/__2.html
- Umweltbundesamt, Committee on Indoor Air Guide Values (2022): Hygienische Leitwerte für die Innenraumluft (hygienic guide values for indoor air; CO₂ guide values from 2008). https://www.umweltbundesamt.de/system/files/medien/4031/bilder/dateien/hygienische_leitwerte_0.pdf