Where this article covers law, it explains EU rules and, as an example, the German rules (Building Modernisation Act, Gebäudemodernisierungsgesetz, GModG); other EU countries implement EU directives in their own laws.
Key points
- AI in building management is neither science fiction nor plug-and-play. Fault detection and energy analytics are proven at scale: in a US campaign covering around 6,500 buildings, median energy savings were 3% for energy information systems and 9% for automated fault detection and diagnostics [4].
- Model predictive control (MPC) achieved average savings of 25 to 30% in field tests, but mostly in small buildings and over short test periods averaging 41 days [5].
- According to a systematic review, no study has yet implemented a “digital twin” with fully automatic feedback into building control [12].
- The biggest obstacle is rarely the algorithm. It is the data foundation: sensor coverage, data quality, consistent naming (semantics) and open interfaces.
- IoT projects often stall between pilot and rollout: in a Cisco survey, 60% of IoT initiatives got stuck at proof of concept [1].
Hype vs reality: how many AI and IoT projects deliver in buildings
Talk about AI in building management usually comes with big promises: the self-driving building, maintenance that predicts faults, energy bills cut in half. At the same time, many owners, operators and manufacturers report pilots that were quietly dropped after a few months. Both are true. This article sets out which applications of AI in building management work today with evidence behind them, under which conditions, and why projects typically fail.
The best-known figure on failed IoT projects comes from a 2017 Cisco survey of 1,845 IT and business decision-makers in the USA, the UK and India. According to Cisco, 60% of IoT initiatives stalled at the proof-of-concept stage, only 26% of companies had an initiative they considered a complete success, and a third of completed projects were not considered a success [1]. The survey covered manufacturing, public administration, retail, energy, transport and healthcare, not buildings specifically. It is also a self-assessment, not a measurement.
A 2018 McKinsey expert survey on Industry 4.0 projects paints a similar picture: only 30% of pilots reached company-wide rollout, 85% of the companies surveyed spent more than a year in pilot mode and 28% more than two years [2]. The term “pilot purgatory” has stuck for this state.
For buildings, there is also a legal dimension. General information, not legal advice (status: October 2026). In Germany, under section 56 of the Building Modernisation Act (GModG), formerly the Buildings Energy Act (GEG), non-residential buildings with heating, air-conditioning or combined ventilation systems with a rated output of more than 70 kW must be equipped with a building automation system by 31 December 2029, where technically feasible and economically reasonable. The system must continuously monitor, log and analyse consumption, detect efficiency losses and provide data through a common, freely configurable interface [16][17]. This creates, in many larger buildings, exactly the data foundation that AI applications could build on. Whether it delivers value depends on how the data are captured, described and used.
AI in building management: five use cases
In building operation, “AI” is an umbrella term for methods that learn patterns from measured data and derive notices, forecasts or control suggestions. Five use cases stand out; they differ widely in maturity and data needs.
Fault detection and diagnostics (FDD)
Automated fault detection and diagnostics (FDD) continuously compares plant readings with rules or learned patterns. Typical findings: heating and cooling running at the same time, a stuck valve, an air handling unit running at night for no reason, a sensor returning implausible values. The technology is not new, but better data access and learning methods have made it more widely usable.
The most robust figures come from the Smart Energy Analytics Campaign, a US public-private partnership evaluated by Lawrence Berkeley National Laboratory (LBNL). Between 2016 and 2020 it supported 104 organisations with around 6,500 buildings. Median annual energy savings were 3% for energy information systems alone and 9% for FDD systems, with a simple payback of about two years [4]. An earlier evaluation of the same campaign found that savings tended to grow over time [3].
The condition behind these numbers matters: savings come not from the software but from someone fixing the faults it finds. The LBNL evaluations look at software combined with a process of ongoing commissioning (monitoring-based commissioning). They also concern mostly US commercial buildings whose owners had actively chosen analytics.
Load and energy forecasting
Forecasting models predict energy use for the coming hours or days from consumption history, weather, calendar and occupancy. They support procurement, load management and the detection of deviations (“consumption is 20% above forecast: why?”), and they are a building block for predictive control. Machine learning for building energy prediction is a well-researched field. A 2023 review of 63 studies found that support vector machines, neural networks and random forests outperformed classical statistical methods more often, but no method was superior under all conditions. The authors criticise that many studies use methods under unsuitable conditions, such as data-hungry models with very small datasets [11].
In practice, the choice of model is rarely the bottleneck. What matters is long, gap-free time series and a clear question about which decision the forecast should improve. How consumption and plant data can be used for maintenance and operation is described on the page on predictive maintenance for building services.
Model predictive control for HVAC (MPC)
Model predictive control (MPC) uses a mathematical model of the building plus forecasts of weather, occupancy or energy prices to run the plant optimally over the coming hours. Instead of reacting once a room is too warm, the controller plans ahead, for example by using the building’s thermal mass. It is the most ambitious form of AI for building energy optimisation.
A critical review published in 2025 analysed field implementations of MPC in real buildings. On average, the studies reported savings of 30% in heating energy, 25% in electricity use, 25% in energy costs, 26% in peak demand and 17% in greenhouse gas emissions [5]. The authors name the limits themselves: the field tests lasted only 41 days on average, most buildings were smaller than 10,000 m², many smaller than 1,000 m², and MPC is not yet widespread in the industry [5]. An LBNL field demonstration in an office building achieved around 40% lower HVAC energy use than the existing controls over two months. The finding on effort is telling: data collection and controller commissioning each took about as much work as building the model itself [6]. A widely cited review of MPC for buildings notes that practical applications are still at an early stage [7].
The high percentages are realistic for well-instrumented buildings, motivated teams and often weak baseline control, and cannot simply be transferred to any existing building. Successful projects are also more likely to be published than failed ones.
Occupancy-based control
Occupant-centric control adapts heating, ventilation or lighting to actual use, measured by presence detectors, people counters, CO₂ readings or booking systems. A 2019 review in Building and Environment found 120 publications on the topic, but only 42 with an implementation in a real building [8].
Two field studies show how much results depend on the individual case. In an office building in the southern USA, HVAC energy demand fell by 43% on working days and 55% on weekends and holidays over 13 months, with no measurable loss of thermal comfort or air quality. However, the people-counting sensors became much less accurate at very high occupancy [9]. In a two-year LBNL study in another office building, air handling unit run times on working days fell by 2 hours 35 minutes per unit per day, measured during the pandemic. For a fully occupied building, the authors estimated 6.1% savings in total energy use, a simulated rather than a measured value [10]. The difference is explained mainly by the starting point, occupancy patterns and the reference value (HVAC share vs total consumption).
Digital twin for buildings: definition, levels and prerequisites
A digital twin is a virtual representation of a building, continuously synchronised with measured data from the real one. The term is used loosely, for anything from a 3D model to a system that controls the building on its own. A systematic review by Deng, Menassa and Kamat (2021) groups the research into five levels [12]:
- BIM applications: a static 3D model for design, scheduling and cost.
- BIM-supported simulation: the model feeds energy, lighting or acoustic simulations.
- BIM linked with IoT: sensor data are connected to the model in real time, for example for energy and indoor climate monitoring.
- BIM with AI prediction: learning models predict states such as maintenance needs or thermal comfort.
- Ideal digital twin: predictions flow back into the building automatically as control actions.
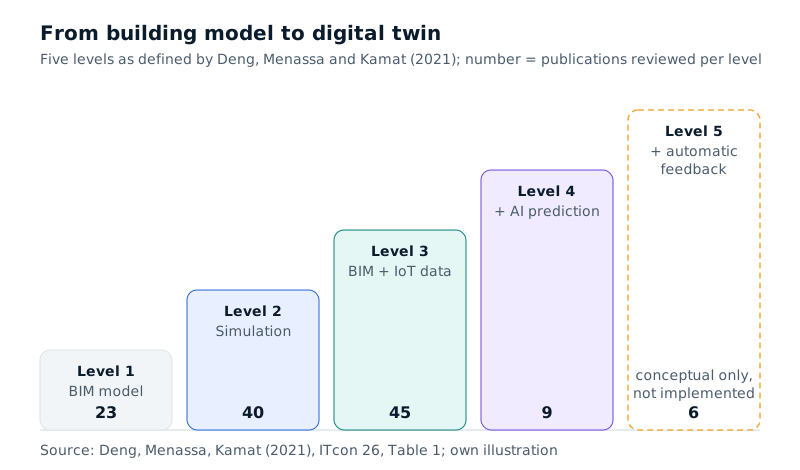 Figure 1: Five levels from a BIM model to a digital twin and the number of publications reviewed at each level. Sources: Deng, Menassa and Kamat (2021) [12], own illustration.
Most of the publications reviewed were at levels 2 and 3. Level 4 had 9 publications, level 5 only 6 conceptual papers. The authors state that no study had reached level 5 [12]. In practice, a digital twin for buildings is therefore built step by step. It needs a reliable as-built model (not necessarily a complete BIM), adequate sensors, consistent descriptions of data points and a clear purpose.
Maturity at a glance: data needs and evidence of benefit
The table below summarises the use cases. The benefits come from the studies cited and apply only under their conditions.
| Use case | Data needed | Maturity | Typical benefit (source, conditions) | Effort |
|---|---|---|---|---|
| Energy monitoring (energy information system) | Meter data, ideally at 15-minute intervals | High, widely used | Median 3% energy savings per year; around 6,500 buildings, mostly USA [4] | Low |
| Fault detection and diagnostics (FDD) | BMS trend data: temperatures, valve positions, operating states, setpoints | High, widely used | Median 9% energy savings per year, payback about two years; requires faults to be fixed [4] | Medium |
| Load and energy forecasting | Long consumption series, weather, calendar, possibly occupancy | Medium to high | Indirect (planning, deviation detection); no method superior in all cases [11] | Low to medium |
| Occupancy-based control | Presence or counting sensors, write access to controls | Medium, few field studies | 6.1% of total consumption (simulated, full occupancy) [10] to 43–55% of HVAC energy (one building, 13 months) [9] | Medium; mind data protection |
| Model predictive control (MPC) | Building model, forecasts, high-quality trend data, write access | Low to medium, mostly pilots | Average 25–30% energy in field tests averaging 41 days [5]; around 40% HVAC energy over two months [6] | High |
| Digital twin with automatic feedback | All of the above plus a building model | Research; no study at level 5 [12] | Not yet reliably quantified | Very high |
Table 1: AI use cases in buildings by data needs, maturity and reported benefit. Sources as cited in each row.
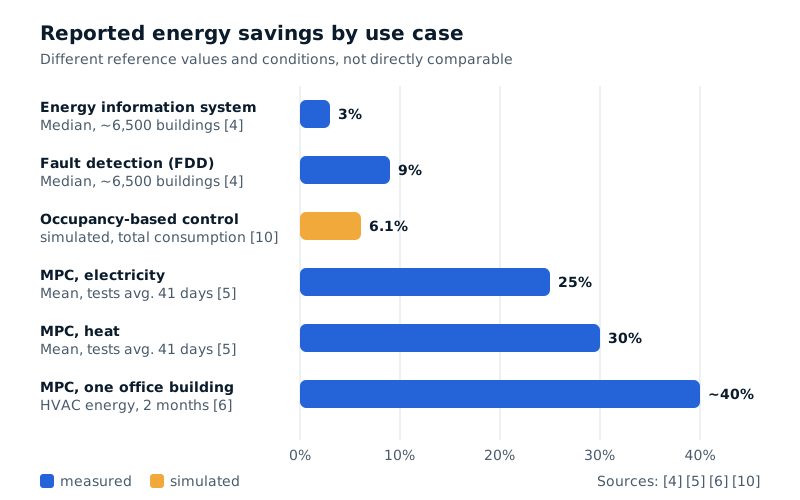 Figure 2: Reported savings per use case with their conditions. The values are not directly comparable (different reference values, buildings and durations). Sources: [4], [5], [6], [10].
The table shows a pattern: the higher the potential benefit, the greater the data needs and the fewer the long-term proofs. For operators, this argues for a sequence: transparency and fault detection first, then forecasting, then control.
Worked example (illustrative; assumptions, not a forecast for any specific building): Assume an office building with energy costs of EUR 200,000 per year. If it achieved the median savings of FDD systems in the LBNL campaign, 9% [4], that would be EUR 18,000 per year. Whether this is achievable depends on the state of the plant, the existing controls and whether the faults found are actually fixed. By definition, half of the campaign participants saved less.
Data first: the main obstacle for smart building analytics
Ask why AI does not scale in existing buildings and the answer almost always comes back to data, across four layers.
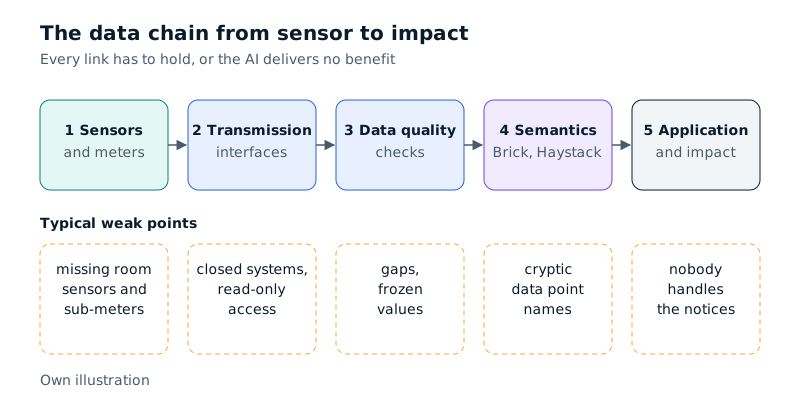 Figure 3: The data chain from sensor to impact. If one link is missing, even the best model cannot help. Own illustration.
Sensor coverage. Many existing buildings measure flow temperatures and main meters, but not room temperatures, CO₂, occupancy or sub-meters. Without these points, a model can detect neither comfort problems nor their causes. So the question is not “Which AI?” but “Which decision should get better, and which measurements does it need?”
Data quality. Typical problems are gaps, frozen values, badly calibrated or swapped sensors, shifting timestamps and trend logs that only record changes. A model learns these errors too. Plausibility checks therefore come before any analysis, including any smart building analytics dashboard.
Semantics. Data points in building automation often have short, vendor-specific names. An analytics program does not know that “AHU2_SAT” is the supply air temperature of air handling unit 2, or which room it serves. Bhattacharya describes this problem in his 2016 Berkeley dissertation: because the meaning of sensors can only be unlocked with expert knowledge of each building, applications have to be adapted for every building and do not scale [13]. One response was Brick, an open metadata schema for buildings. In validation, 98% of the data points in the buildings studied could be mapped to Brick [13]. Brick describes itself as an open initiative to standardise semantic descriptions of physical, logical and virtual assets in buildings [14]. A related approach is Project Haystack, an open-source initiative that standardises semantic data models and web services for IoT data [15]. Both serve one purpose: making an application transferable from one building to the next.
Interfaces. Data from building automation, meters and new sensors have to come together in one place. In building automation, BACnet is widespread, standardised as EN ISO 16484-5 “Building automation and control systems – Part 5: Data communication protocol” [18]. For analytics, it often matters whether data may only be read or setpoints may also be written, and who is responsible for that. In Germany, section 56(2) GModG explicitly requires a common, freely configurable interface for the buildings concerned, so that analysis is possible independently of manufacturers and companies [17]. The German Energy Agency (dena) refers to the AMEV recommendation “Technisches Monitoring 2025” and the guideline VDI 6041 for implementing technical monitoring [16].
IoT sensors for buildings: LoRaWAN, EnOcean, Wi-Fi or wired?
Where measurement points are missing, IoT sensors for buildings are retrofitted, wired or wireless. The right technology depends on building structure, measured quantity, interval, power supply and existing IT. The table compares the common options neutrally. Range and battery life figures from the industry alliances apply under favourable conditions and are not guarantees.
| Criterion | LoRaWAN | EnOcean | Wi-Fi | Wired (e.g. BACnet, Modbus, KNX) |
|---|---|---|---|---|
| Principle | Low-power wide-area radio network, licence-free ISM bands [19] | Radio with energy harvesting from motion, light or heat; ISO/IEC 14543-3-1X, 868 MHz in Europe [20] | Existing IT wireless networks in the building | Fixed cabling in building automation |
| Power supply | Battery; more than 10 years possible according to the LoRa Alliance [19] | Often battery-free [20] | Usually mains adapter, due to higher power needs | Via the installation |
| Range | Long; up to 15 km in rural areas according to the LoRa Alliance, much less indoors [19] | Up to about 30 m indoors according to the EnOcean Alliance [20] | Limited to the Wi-Fi network | Determined by the cabling |
| Data volume and interval | Small packets, typically minute intervals | Small packets, event- or interval-based | High data rates, short intervals possible | High, depending on the bus |
| Infrastructure | Gateways and network server | Receivers or gateways | Wi-Fi access, coordination with IT | Cable routes, sub-distribution boards |
| Typical strength | Large areas, multiple buildings, basements and shafts | Switches, presence detectors, room sensors without battery changes | Devices with many measured values, quick commissioning | High reliability, control tasks |
| Typical limit | Less suited to frequent or large data volumes | Limited range, energy budget | Power demand, IT security and network approvals | Cost and effort in existing buildings |
Table 2: Wireless and wired options for building sensors compared. Industry alliance figures as cited [19][20].
LoRaWAN sensors suit, for example, meter readings, temperatures or humidity in sprawling sites without Wi-Fi. For quantities with many values at short intervals, or for control tasks, a wired connection or Wi-Fi is often the better fit. In practice the standards are combined.
Why IoT projects fail, and what successful ones do differently
The Cisco survey also asked about success factors. Three of the four most important concerned people and organisation rather than technology: collaboration between IT and the business (54% of respondents), a technology-friendly culture with management support (49%) and IoT expertise in-house or at partners (48%) [1]. It is also striking that 35% of IT decision-makers rated their initiatives a complete success, but only 15% of business decision-makers [1]. Success is evidently defined differently.
From the studies cited and the logic of the data chain, typical failure patterns emerge. They are also the short answer to why IoT projects fail:
- Technology before the question: a platform or sensor package is rolled out without clarity about which decision should improve.
- Pilot without a rollout plan: the pilot works in one building thanks to a lot of manual effort that cannot be repeated across twenty buildings. This is the core of “pilot purgatory” [2].
- Underestimated data work: data collection and commissioning are often as demanding as the modelling itself, as the LBNL MPC field demonstration shows [6].
- Nobody owns the notices: fault messages pile up but no one is tasked with dealing with them. That is why the LBNL campaign combines software with an operating process [4].
- Closed systems: data sit in a vendor solution without an open interface. Every new application starts from scratch.
- No way to measure success: without a baseline and agreed metrics, nobody can say after a year whether the project worked.
Successful projects reverse these points: they start with a concrete operational problem, define metrics in advance, describe data points consistently, build on existing building automation, name the people responsible for handling notices and plan the rollout during the pilot. This applies especially to industrial companies, where production and building services are often tightly linked; see the page on industrial buildings.
EU AI Act and GDPR: what applies to building AI and occupancy data
General information, not legal advice (status: October 2026).
EU AI Act. The AI Act (Regulation (EU) 2024/1689) takes a risk-based approach [21]. Annex III lists as high-risk, among others, AI systems intended to be used as safety components in the management and operation of critical digital infrastructure, road traffic or the supply of water, gas, heating or electricity (Annex III point 2), and systems intended to monitor and evaluate the performance and behaviour of employees (Annex III point 4(b)) [22]. A consumption forecast or fault detection in an office building is unlikely to fall under these in many cases. It may be different if AI takes over safety-related functions in supply systems, or if occupancy data are used to assess individual employees. This has to be checked case by case. The “Digital Omnibus on AI” (Regulation (EU) 2026/1744, in force since 27 July 2026) postponed the obligations for high-risk systems under Annex III to 2 December 2027, and for systems under Annex I to 2 August 2028 [23][24].
GDPR and occupancy data. Occupancy data can be personal data if they can be linked to an identified or identifiable person, for example in single offices, small rooms or in combination with access or booking data. The General Data Protection Regulation (GDPR) then applies [25]. Where processing is likely to result in a high risk, in particular when using new technologies, a data protection impact assessment under Article 35 GDPR is required [25]. In Germany, where a company has a works council, it has a right of co-determination under section 87(1) no. 6 of the Works Constitution Act (Betriebsverfassungsgesetz, BetrVG) when technical equipment designed to monitor employees’ behaviour or performance is introduced [26]. In practice it works well to capture occupancy as coarsely as possible (number of people per zone rather than identity), aggregate data early, and involve the data protection officer and employee representatives from the start.
How Nebatic helps
In its custom AI and IoT solutions, Nebatic develops projects together with a building’s existing systems and with the installers and integrators involved. This includes analysing existing building and consumption data with AI methods, building IoT sensor networks, dashboards and demand-led control approaches. Which sensors are used is decided per project; existing sensors, meters and building systems can be connected. For service providers, the page on AI in facilities management describes how this can fit into day-to-day operations.
For digital twin projects, Nebatic creates the data foundation in individual projects: measurement points, consistent data descriptions and interfaces. Nebatic does not offer a ready-made “digital twin” product. Nebatic does not install conventional building automation and does not replace safety-related alarm systems or maintenance to the manufacturer’s specification.
Limits and risks
AI can only analyse what is measured. Missing or faulty measurement points lead to false notices or overlooked problems. The savings figures in this article come mostly from US buildings, from studies with motivated participants and partly from short test periods. They are a guide, not a promise for any particular building.
Analytics does not replace professional maintenance, safety systems such as fire or gas detection, or engineering design. Changes to HVAC controls should be agreed with the installer or system integrator responsible for the plant’s warranty and function. For questions on energy efficiency and funding, energy advisers are the right contacts (in Germany also the funding bodies BAFA and KfW). Legal questions on the AI Act, the GDPR and co-determination are for data protection officers and specialist lawyers. Radio standards and new sensors also affect IT security, so the IT department should be involved early.
Frequently asked questions
What can AI do in facilities management today?
Fault detection and energy analytics have the best evidence. In the Smart Energy Analytics Campaign, median annual energy savings were 9% for fault detection systems and 3% for energy information systems alone [4]. For facility management this mainly means more targeted call-outs instead of searching for causes. The precondition is that someone acts on the notices.
Can machine learning reliably predict building energy use?
Yes, if there are long, clean consumption series plus weather and calendar data. A review of 63 studies found no method that is superior under all conditions; a common mistake is using data-hungry models with too little data [11].
What is the difference between a digital twin and a BIM model?
A building model such as BIM is a static representation. A digital twin is continuously synchronised with measured data and, ideally, feeds predictions back into the controls automatically. According to a systematic review, no study has yet reached this highest level [12].
Does model predictive control (MPC) for HVAC really save energy?
In field tests, MPC achieved average savings of 25 to 30%, but the tests lasted only 41 days on average and most buildings were smaller than 10,000 m² [5]. An LBNL demonstration in an office building saved around 40% of HVAC energy over two months, with considerable effort for data collection and commissioning [6].
When are LoRaWAN sensors a good choice for buildings?
Mainly for large or spread-out sites, basements and plant rooms without Wi-Fi, and for quantities with small data volumes such as meter readings or temperatures. For short measurement intervals or control tasks, Wi-Fi or wired solutions are often better suited [19].
Why do so many IoT projects get stuck at the pilot stage?
Pilots often run on manual effort that cannot be repeated, and responsibilities, metrics and interfaces are missing. In the 2017 Cisco survey, 60% of initiatives stalled at proof of concept, and the most important success factors were organisational [1].
Does the EU AI Act apply to AI in building management?
The AI Act applies to AI systems in general, but only certain purposes count as high-risk, such as safety components in heating or electricity supply or the monitoring of employees [22]. Under current rules, the obligations for these systems apply from 2 December 2027 [24]. General information, not legal advice (status: October 2026).
Sources
- Cisco (2017): Cisco Survey Reveals Close to Three-Fourths of IoT Projects Are Failing. Press release, 22.05.2017. https://newsroom.cisco.com/c/r/newsroom/en/us/a/y2017/m05/cisco-survey-reveals-close-to-three-fourths-of-iot-projects-are-failing.html
- Narayanan, S.; Coxon, M. / McKinsey & Company (2018): It’s the last IT/OT mile that matters in avoiding Industry 4.0’s pilot purgatory. https://www.mckinsey.com/capabilities/operations/our-insights/operations-blog/its-the-last-it-ot-mile-that-matters-in-avoiding-industry-40s-pilot-purgatory
- Kramer, H.; Lin, G.; Curtin, C.; Crowe, E.; Granderson, J. (2019): Building analytics and monitoring-based commissioning: industry practice, costs, and savings. Energy Efficiency, DOI 10.1007/s12053-019-09790-2. https://eta-publications.lbl.gov/publications/building-analytics-and-monitoring
- Kramer, H.; Curtin, C.; Lin, G.; Crowe, E.; Granderson, J. / Lawrence Berkeley National Laboratory (2020): Proving the Business Case for Building Analytics. https://eta-publications.lbl.gov/publications/proving-business-case-building
- Saloux, E.; Candanedo, J. A.; Vallianos, C.; Morovat, N.; Zhang, K. (2025): From theory to practice: A critical review of model predictive control field implementations in the built environment. Applied Energy 393, 126091. https://pure.etsmtl.ca/en/publications/from-theory-to-practice-a-critical-review-of-model-predictive-con
- Blum, D.; Wang, Z.; Weyandt, C.; Kim, D.; Wetter, M.; Hong, T.; Piette, M. A. (2022): Field demonstration and implementation analysis of model predictive control in an office HVAC system. Applied Energy 318, 119104. https://eta-publications.lbl.gov/publications/field-demonstration-and
- Drgoňa, J. et al. (2020): All you need to know about model predictive control for buildings. Annual Reviews in Control. https://smartersmallbuildings.lbl.gov/publications/all-you-need-know-about-model
- Park, J. Y.; Ouf, M. M.; Gunay, B.; Peng, Y.; O’Brien, W.; Kjærgaard, M. B.; Nagy, Z. (2019): A critical review of field implementations of occupant-centric building controls. Building and Environment 165, 106351. https://www.sciencedaily.com/releases/2019/11/191120175607.htm
- Pang, Z.; Guo, M.; O’Neill, Z.; Smith-Cortez, B.; Yang, Z. (2026): A longitudinal field study of sensor-driven occupancy-centric HVAC controls in an office building. Energy and Buildings 351, 116693. https://repository.lsu.edu/construction_management_pubs/644
- Lin, G.; Casillas, A.; Sheng, M.; Granderson, J. (2023): Performance Evaluation of an Occupancy-Based HVAC Control System in an Office Building. Energies 16(20), 7088. https://eta-publications.lbl.gov/publications/performance-evaluation-occupancy
- Olu-Ajayi, R.; Alaka, H.; Owolabi, H.; Akanbi, L.; Ganiyu, S. (2023): Data-Driven Tools for Building Energy Consumption Prediction: A Review. Energies 16(6), 2574. https://uhra.herts.ac.uk/id/eprint/10374/
- Deng, M.; Menassa, C. C.; Kamat, V. R. (2021): From BIM to digital twins: a systematic review of the evolution of intelligent building representations in the AEC-FM industry. Journal of Information Technology in Construction (ITcon) 26, 58–83. https://www.itcon.org/paper/2021/5
- Bhattacharya, A. (2016): Enabling Scalable Smart-Building Analytics. Dissertation, UC Berkeley, Technical Report UCB/EECS-2016-201. https://www2.eecs.berkeley.edu/Pubs/TechRpts/2016/EECS-2016-201.pdf
- Brick Consortium: Brick Schema. https://brickschema.org/
- Project Haystack. https://project-haystack.org/
- Deutsche Energie-Agentur (dena) / KEDi (2025): Verpflichtende Gebäudeautomation in Nichtwohngebäuden (mandatory building automation in non-residential buildings; § 71a GEG, title under the former numbering, now § 56 GModG), dossier part 1: existing buildings. https://www.dena.de/fileadmin/dena/Publikationen/PDFs/2025/KEDi_Dossier_71a_GEG_Bestand.pdf
- Building Modernisation Act (Gebäudemodernisierungsgesetz, GModG, formerly Gebäudeenergiegesetz), section 56 Building automation and building control (status October 2026). https://www.gesetze-im-internet.de/geg/__56.html
- DIN EN ISO 16484-5:2023-02: Building automation and control systems – Part 5: Data communication protocol. https://www.dinmedia.de/en/standard/din-en-iso-16484-5/324847803
- LoRa Alliance: About LoRaWAN. https://lora-alliance.org/about-lorawan/
- EnOcean Alliance: What is EnOcean. https://www.enocean-alliance.org/what-is-enocean/
- Regulation (EU) 2024/1689 (Artificial Intelligence Act) of 13 June 2024. https://eur-lex.europa.eu/eli/reg/2024/1689/oj
- AI Act, Annex III: High-risk AI systems referred to in Article 6(2). https://artificialintelligenceact.eu/annex/3/
- Regulation (EU) 2026/1744 of 8 July 2026 (Digital Omnibus on AI). https://eur-lex.europa.eu/eli/reg/2026/1744/oj
- Cuatrecasas (2026): Digital Omnibus on AI has been published. https://www.cuatrecasas.com/en/spain/intellectual-property/art/digital-omnibus-ai-has-been-published
- Regulation (EU) 2016/679 (General Data Protection Regulation). https://eur-lex.europa.eu/legal-content/EN/TXT/HTML/?uri=CELEX:32016R0679
- Works Constitution Act (Betriebsverfassungsgesetz, BetrVG), section 87 Rights of co-determination. https://www.gesetze-im-internet.de/betrvg/__87.html